







Before you perform a performance assessment, follow the instructions in this topic to obtain traffic files from an Aurora MySQL instance, an AWS MySQL instance, an RDS MySQL instance, or a PolarDB MySQL instance.
Prerequisites
- You have created an Amazon Aurora MySQL instance or an AWS MySQL instance.
- You have registered an Alibaba Cloud account and created an RDS MySQL instance or PolarDB MySQL instance.
Before you do performance assessment, enable audit logging for your Amazon Aurora MySQL instance to collect audit logs that meet the specified criteria. After collection, export the logs to CloudWatch, and then export the audit logs from CloudWatch to S3 for subsequent parsing and replay.
Enable audit logging on your Amazon Aurora MySQL instance.
Open CloudWatch and import the collected audit logs.
Export the audit logs from CloudWatch to Amazon S3.
Enable audit logging for your Amazon Aurora MySQL instance
(Optional) Create a custom DB cluster parameter group.
Before enabling audit logging, you must create a custom DB cluster parameter group. If you have already created one, you can skip this step.
Log in to the Amazon and RDS Console.
In the left navigation pane, click Parameter groups.
On the Parameter groups page, click Create parameter group in the upper-right corner under the Custom tab.
On the Create parameter group page, configure the following parameters.
ParameterDescriptionGroup Name The name of a customized parameter group. This topic uses oma-parameter-group as an example. Must start with a letter, length between 1-255 characters, and cannot end with a hyphen (-) or contain two consecutive hyphens. Valid characters include A-Z, a-z, 0-9, and hyphens. Description Provide a brief description of the parameter group. Engine type Select Aurora MySQL here. Parameter group family Select the parameter group corresponding to the database version you are using. For example, if you are using Aurora MySQL database V8.0, then select aurora-mysql8.0 here. Type The type for the DB parameter group. Here, select DB Cluster Parameter Group. Click Create.
Associate the DB cluster parameter group with your Amazon Aurora MySQL instance.
Return to the Amazon Aurora and RDS Console home page and click Databases in the left navigation pane.
On the Databases page, select the target DB cluster and click Modify.
In the Additional configuration section of the Modify global database page, choose your created DB cluster parameter group oma-parameter-group from the drop-down list under DB cluster parameter group.
Click Continue.
In the Apply immediately section of the Modify global database page, select Apply immediately for When to apply modifications.
Click Modify cluster.
Make sure that the database cluster parameter group is associated with the Amazon Aurora MySQL instance.
Return to the Database page, select the Aurora MySQL instance, and click Actions > Reboot in the upper right corner.
Note
After you modify the database cluster parameter group associated with a database instance, you must reboot for the changes to take effect. However, rebooting will affect all database instances in the database cluster, so confirm the risks before proceeding. For more information, see Parameter Groups Overview.
On the Reboot database instance page, click Confirm.
After the reboot is successful, click the database identifier of the Aurora MySQL instance on the Databases page.
On the details page of the Aurora MySQL instance, click the Configuration tab.
In the Configuration tab, wait until the status of DB instance parameter group shows as In sync, which indicates successful association.
Enable advanced auditing.
Return to the Aurora and RDS Console home page and click Parameter groups in the left navigation pane.
Under the Custom tab of the Parameter groups page, select the parameter group you created, and click Actions > Edit in the upper-right corner.
In the Modifiable parameters page, search for
server_audit_loggingand set the value to 1.Click Save Changes.
Configure audit logging.
Return to the Aurora and RDS Console home page and click Parameter groups in the left navigation pane.
In the Parameter groups > Custom page, select the parameter group you created, and click Actions > Edit.
In the Modifiable parameters page, search for
server_audit_eventsand set the value to CONNECT,QUERY,QUERY_DCL,QUERY_DDL,QUERY_DML,TABLE.This parameter is used to configure audit options for different database events. Multiple events should be separated by commas without spaces.
Click Save Changes.
Confirm audit logging for your Amazon Aurora MySQL instance.
Return to the home page of the Aurora and RDS console and click Databases in the left navigation pane.
On the Databases page, click the identifier for the Aurora MySQL database instance.
On the Aurora MySQL DB instance details page, click the Logs & events tab.
In the Logs section of the Logs & events tab, select
audit/audit.logand click View in the upper-right corner.
Export audit logs to CloudWatch
You can publish the logs from your Amazon Aurora MySQL instance to Amazon CloudWatch Logs.
Return to the Amazon RDS Console, click Databases on the left navigation pane.
On the Databases page, select the target DB cluster and click Modify.
In the Additional monitoring settings > Log exports section, choose the types of logs to publish to Amazon CloudWatch Logs.
Notice
Audit log is mandatory for selection, and you can select other log types as needed.
Click Continue.
In the Apply immediately section of the Modify global database page, select Apply immediately for When to apply modifications.
Click Modify clusters.
Export audit logs from CloudWatch to S3
Note
Note that using the S3 service will incur costs.
You can choose to export audit logs and import them to the target S3 bucket within the same account or in a different account. This topic covers the procedure using the same account. For exporting using a different account, refer to the AWS official documentation.
Preparations
Before you create a task to export audit logs to S3, you need to do preparations. For more information, see Export log data to Amazon S3 using the console for specific steps.
Create an export task
Log in to the CloudWatch Console using your authorized account.
In the left navigation pane, click Logs > Log groups.
On the Log groups page, select the target log group and click Actions > Export data to Amazon S3 in the upper-right corner.
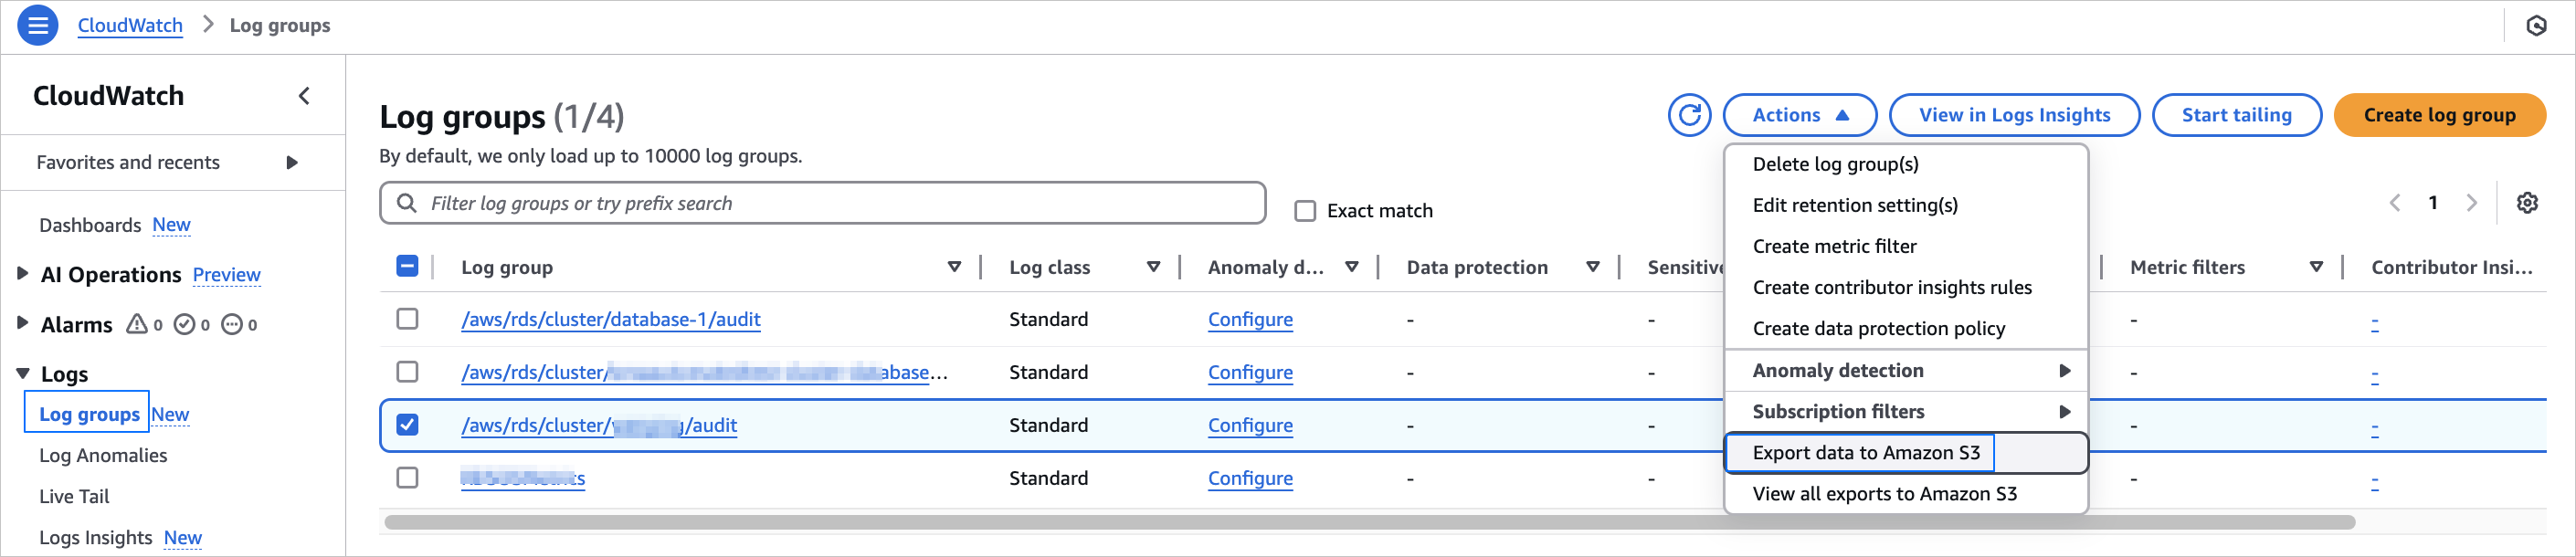
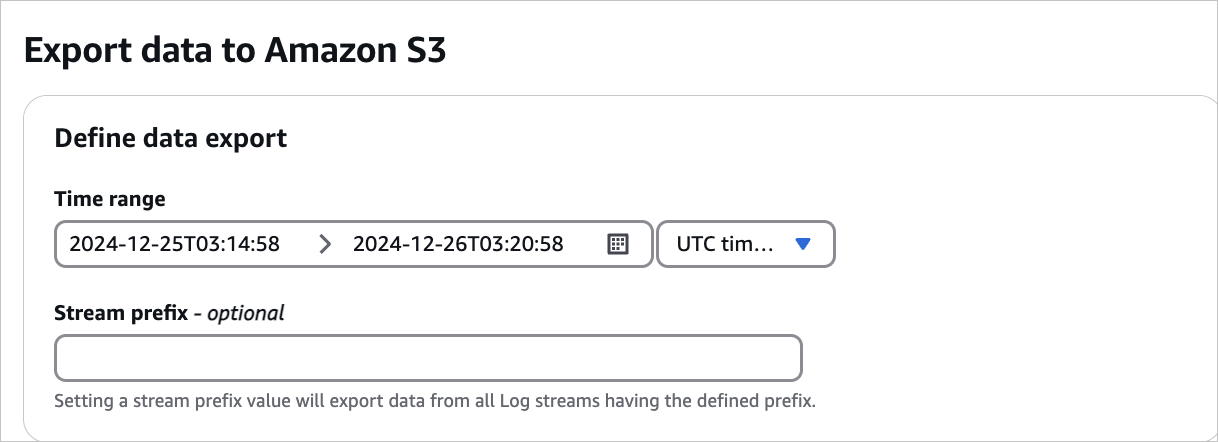
In the Define data export section on the Export data to Amazon S3 page, select the time range for the data you want to export.
In the Choose S3 bucket section, configure the following parameters.
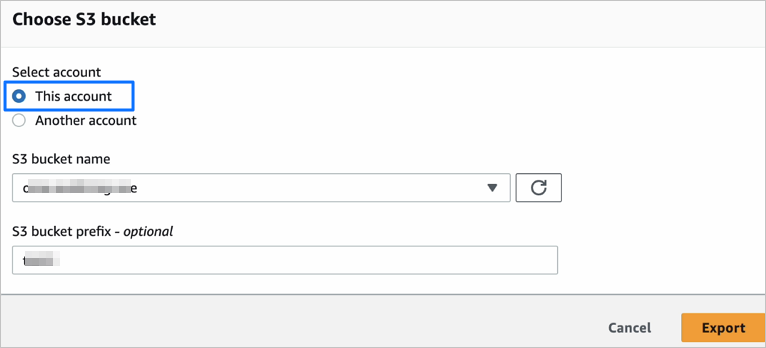 ParameterDescription
Select account Select either This account or Another account. In this example, we choose This account. S3 bucket name Choose the name of the S3 bucket you created from the drop-down list. S3 bucket prefix - optional Customize the prefix for the S3 bucket. Click Export.
View export tasks
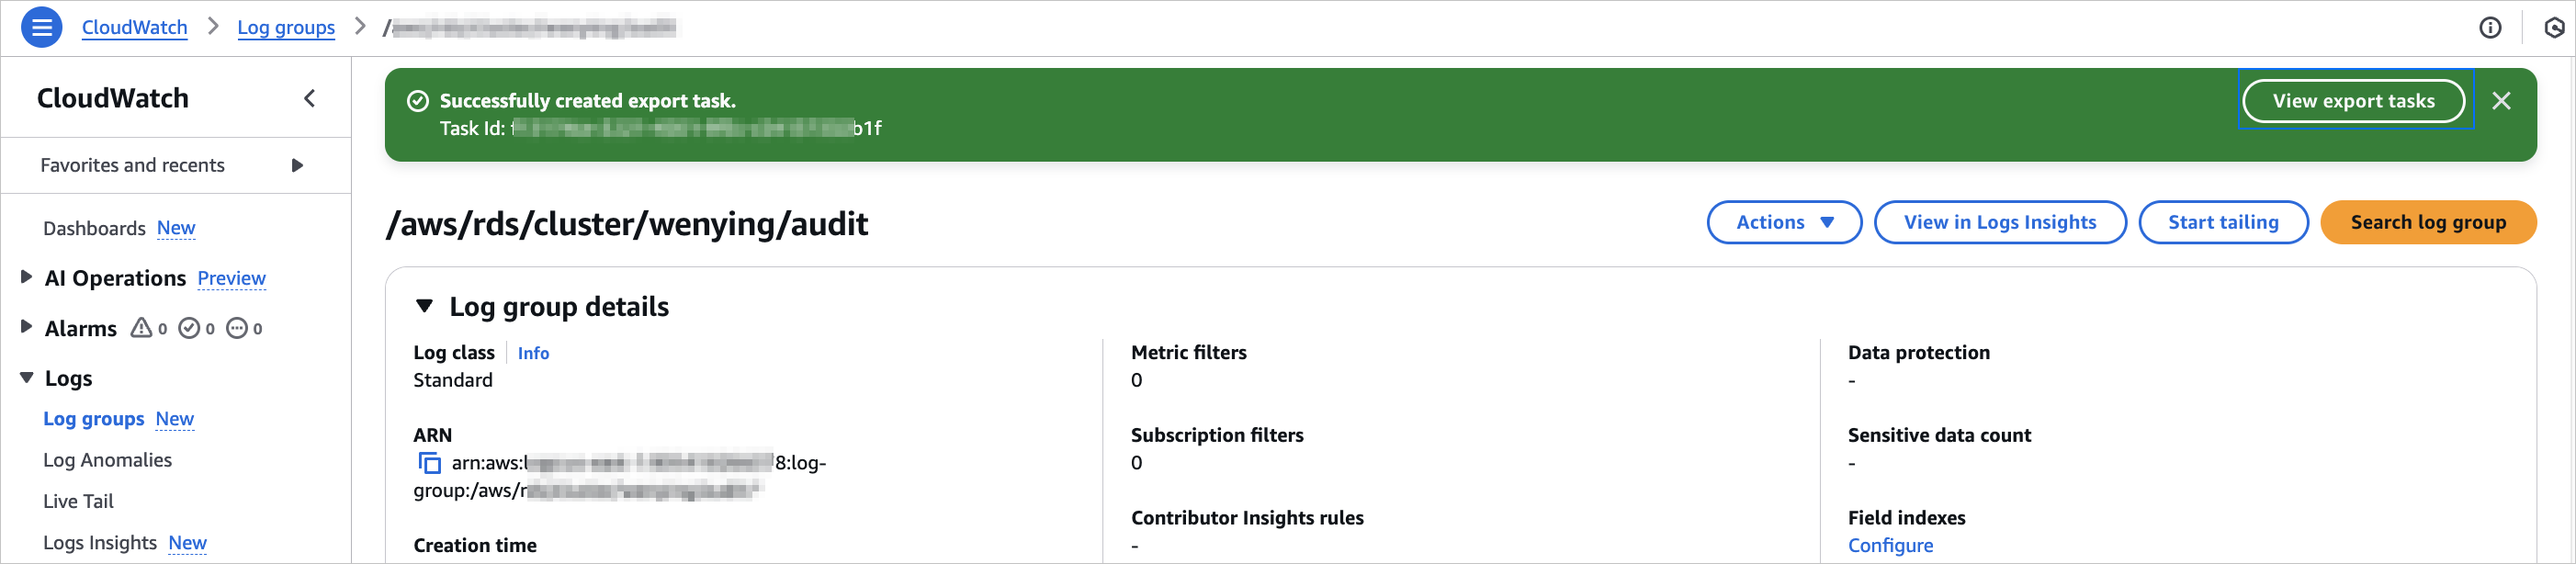
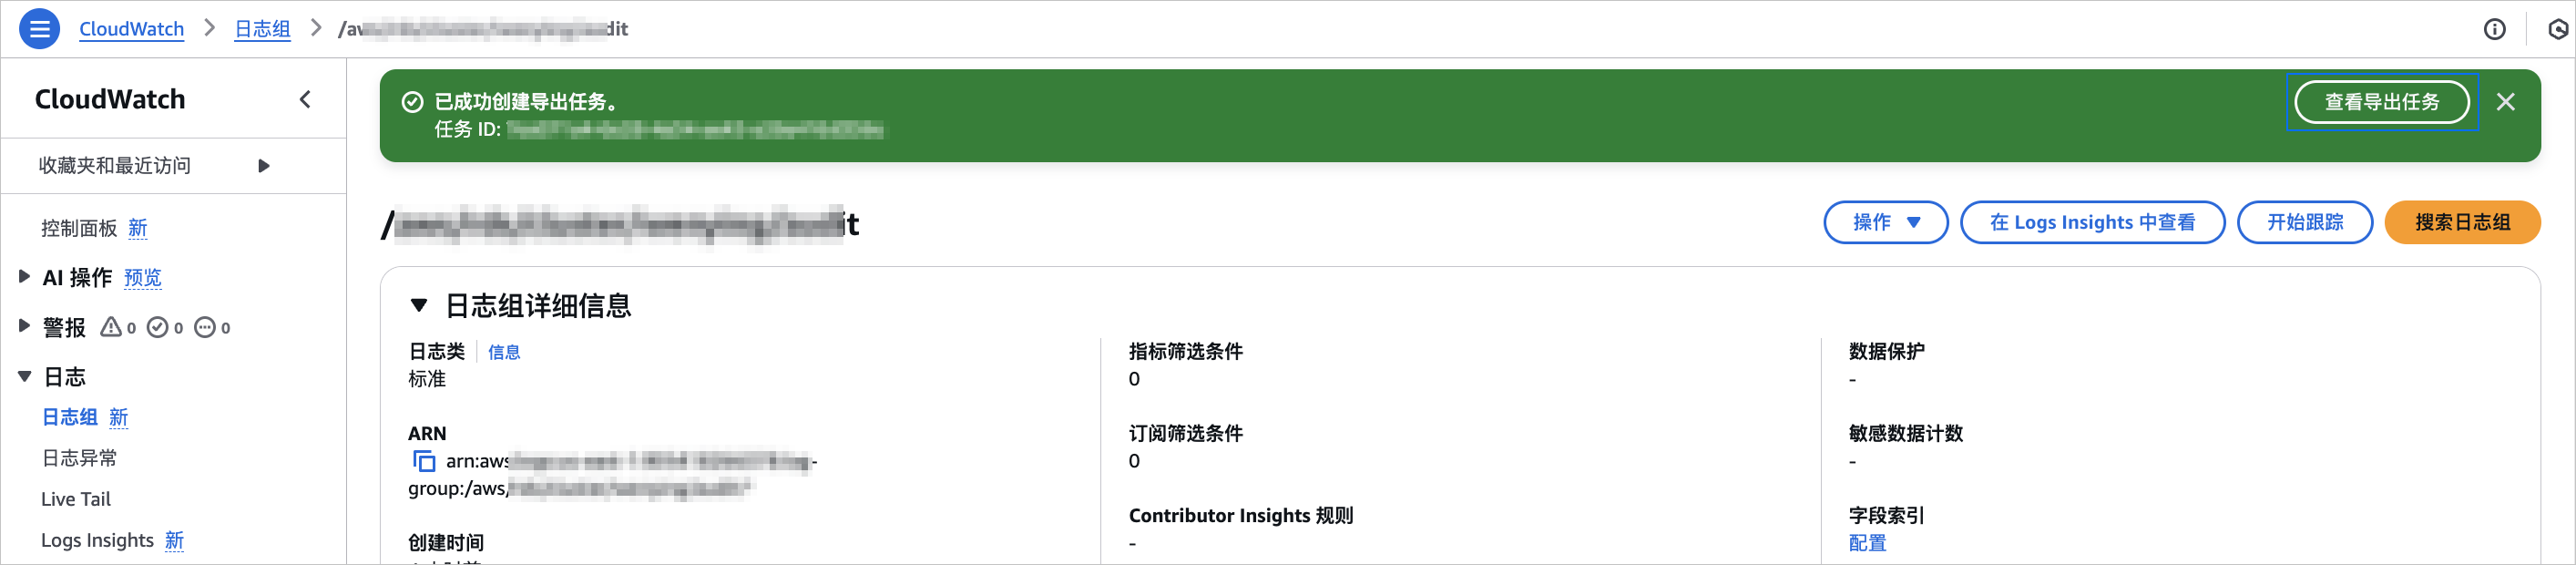
After successfully creating an export task, you will be automatically directed to the log group details page where you can view the details of the export task.
Click View export tasks in the upper-right corner.
On the Export tasks page, select the completed export task and click View in Amazon S3 in the upper-right corner to view all the exported logs.

Enable the audit log feature
(Optional) Create a custom option group.
Before you enable the audit log feature, you must create a custom option group. If you have already created one, skip this step.
Log in to the Amazon and RDS console.
In the left-side navigation pane, click Option groups.
On the Option groups page, click Create group in the upper-right corner.
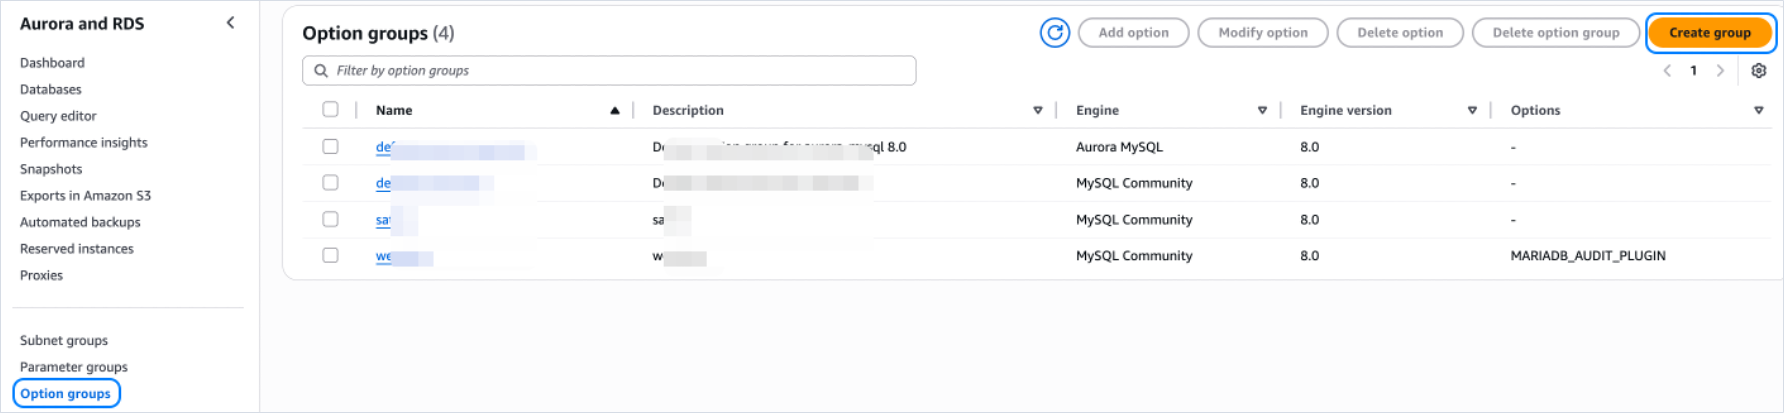
On the Create group page, configure the parameters.
ParameterDescriptionName The name of the custom option group. Description A brief description of the option group. Engine Select MySQL. Major engine version Select the MySQL version as needed. Click Create.
Add an option to the option group.
Return to the Option groups page and click the name of the target option group.
In the Options section of the details page, click Add option in the upper-right corner.
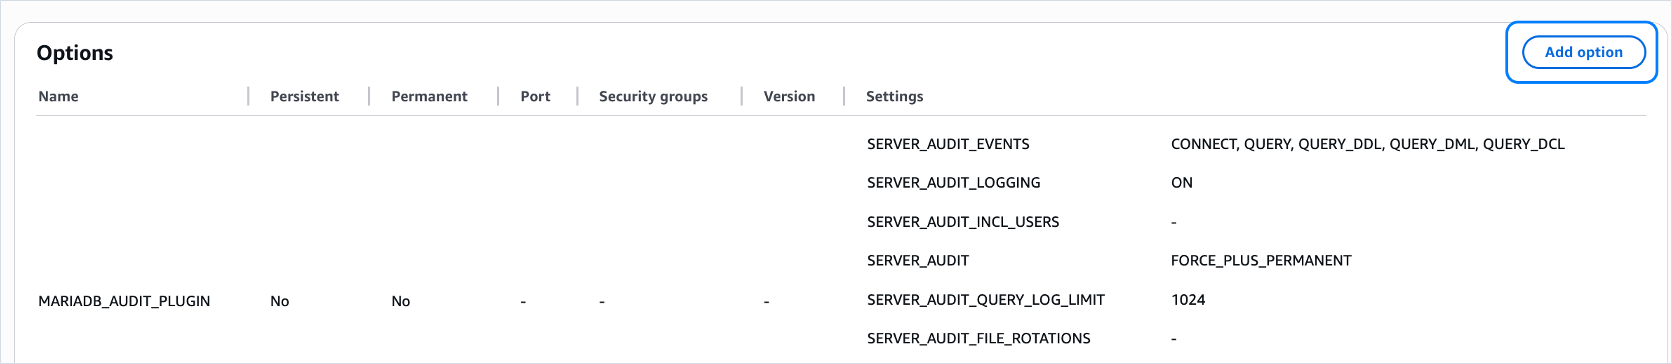
On the Add Option page, configure the parameters.
ParameterDescriptionOption name Select MARIADB_AUDIT_PLUGIN. Option settings In the SERVER_AUDIT_EVENTS field, specify the value as needed. For example, CONNECT,QUERY,QUERY_DDL,QUERY_DML,QUERY_DCL.Note
Do not set both
QUERY_DMLandQUERY_DML_NO_SELECT. Select one as needed.Separate multiple values with commas (,), and do not include spaces.
Apply immediately Specify whether to apply the settings immediately. Click Add option in the lower-right corner of the page.
Export audit logs to CloudWatch
You can export the logs of an Amazon Aurora MySQL instance to Amazon CloudWatch Logs.
Return to the Amazon and RDS console homepage and click Databases in the left-side navigation pane.
On the Databases page, select the target database cluster and click Modify.

In the Additional monitoring configuration > Log exports section, select the log type to export to Amazon CloudWatch Logs.
Notice
Audit log is a required field. Select other log types as needed.
In the Additional configuration > Database options section, select the option group that you created earlier.

Click Continue.
In the Plan the modification section on the Modify database instance page, set When to apply the modification to Immediately.
Click Modify database instance.
Export audit logs from CloudWatch to S3
Note
Using the S3 service will incur costs. Proceed as needed.
You can choose to export audit logs to an Amazon S3 bucket in the same account or a different account. This example shows the process for the same account. For a different account, see the AWS docs.
Prerequisites
Before you create a task to export audit logs to S3, complete the following prerequisites. For more information, see Export log data to Amazon S3 using the console.
Create an export task
Log in to the CloudWatch console with an account that has been authorized and select the target region in the upper-right corner of the page.
In the left-side navigation pane, select Logs > Log groups.
ParameterDescriptionSelect account Select This Account or Another Account. In this example, This Account is selected. S3 bucket name Select the name of the created S3 bucket from the drop-down list. S3 bucket prefix - Optional Enter a custom prefix for the S3 bucket. Click Export.
View an export task
After you create an export task, you will be automatically redirected to the log group details page. On this page, you can view the details of the export task.
<!---->

<!---->

Log Audit Service allows you to quickly enable log collection. After you enable audit log collection, SQL Explorer (SQL Audit) will be automatically activated for eligible RDS instances.
Log Audit Service can collect logs from cloud products including storage, network, and databases. After collection, logs are automatically stored in the corresponding Logstore or Metricstore.
Initial configuration
Notice
This operation only needs to be performed once.
Log in to the Log Service console.
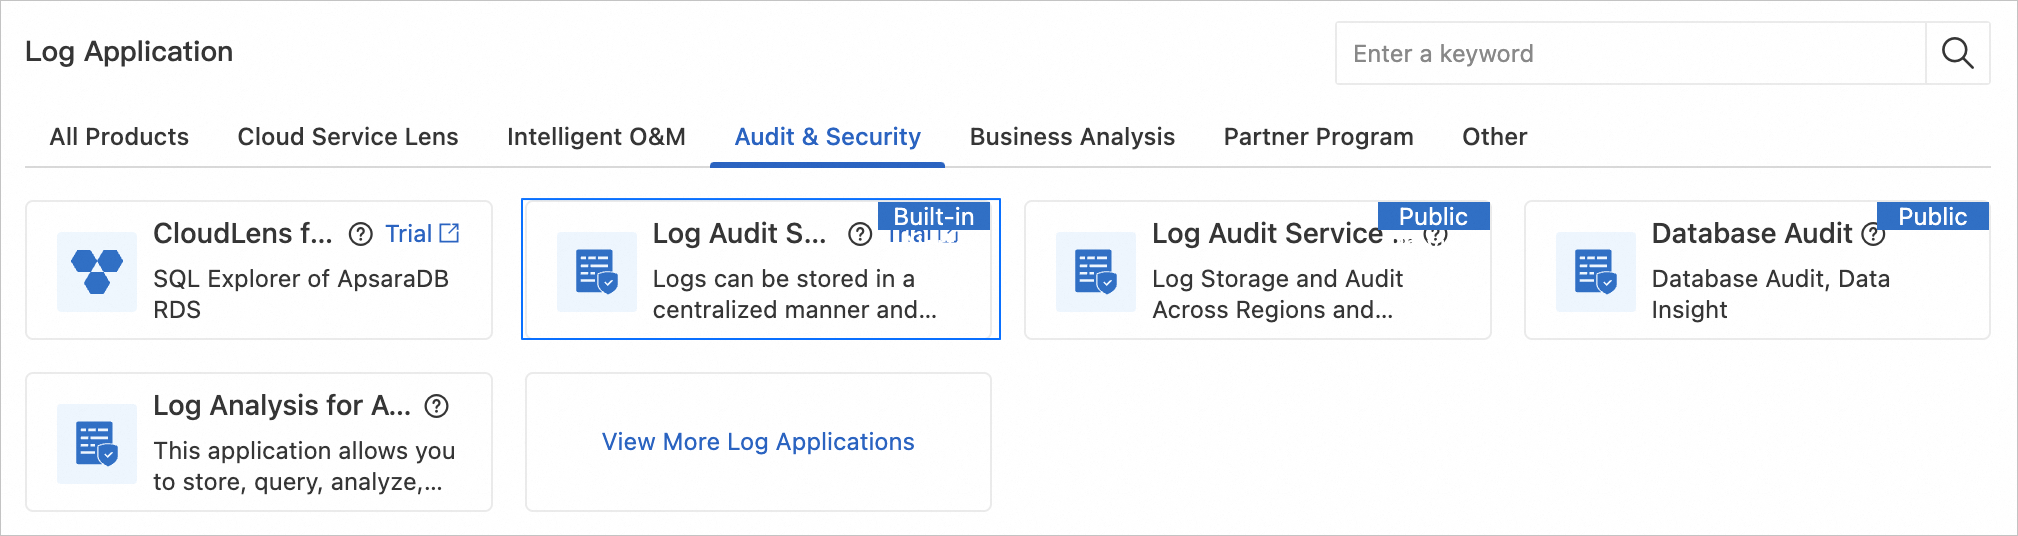
Complete the authorization following the page prompts.
After authorization, Log Audit Service will use the service-linked role
AliyunServiceRoleForSLSAuditto collect logs from cloud products.
Enable log collection
Enable SQL audit log collection.
Go to Log Audit Service > Cloud Product Access > Global Configurations page.
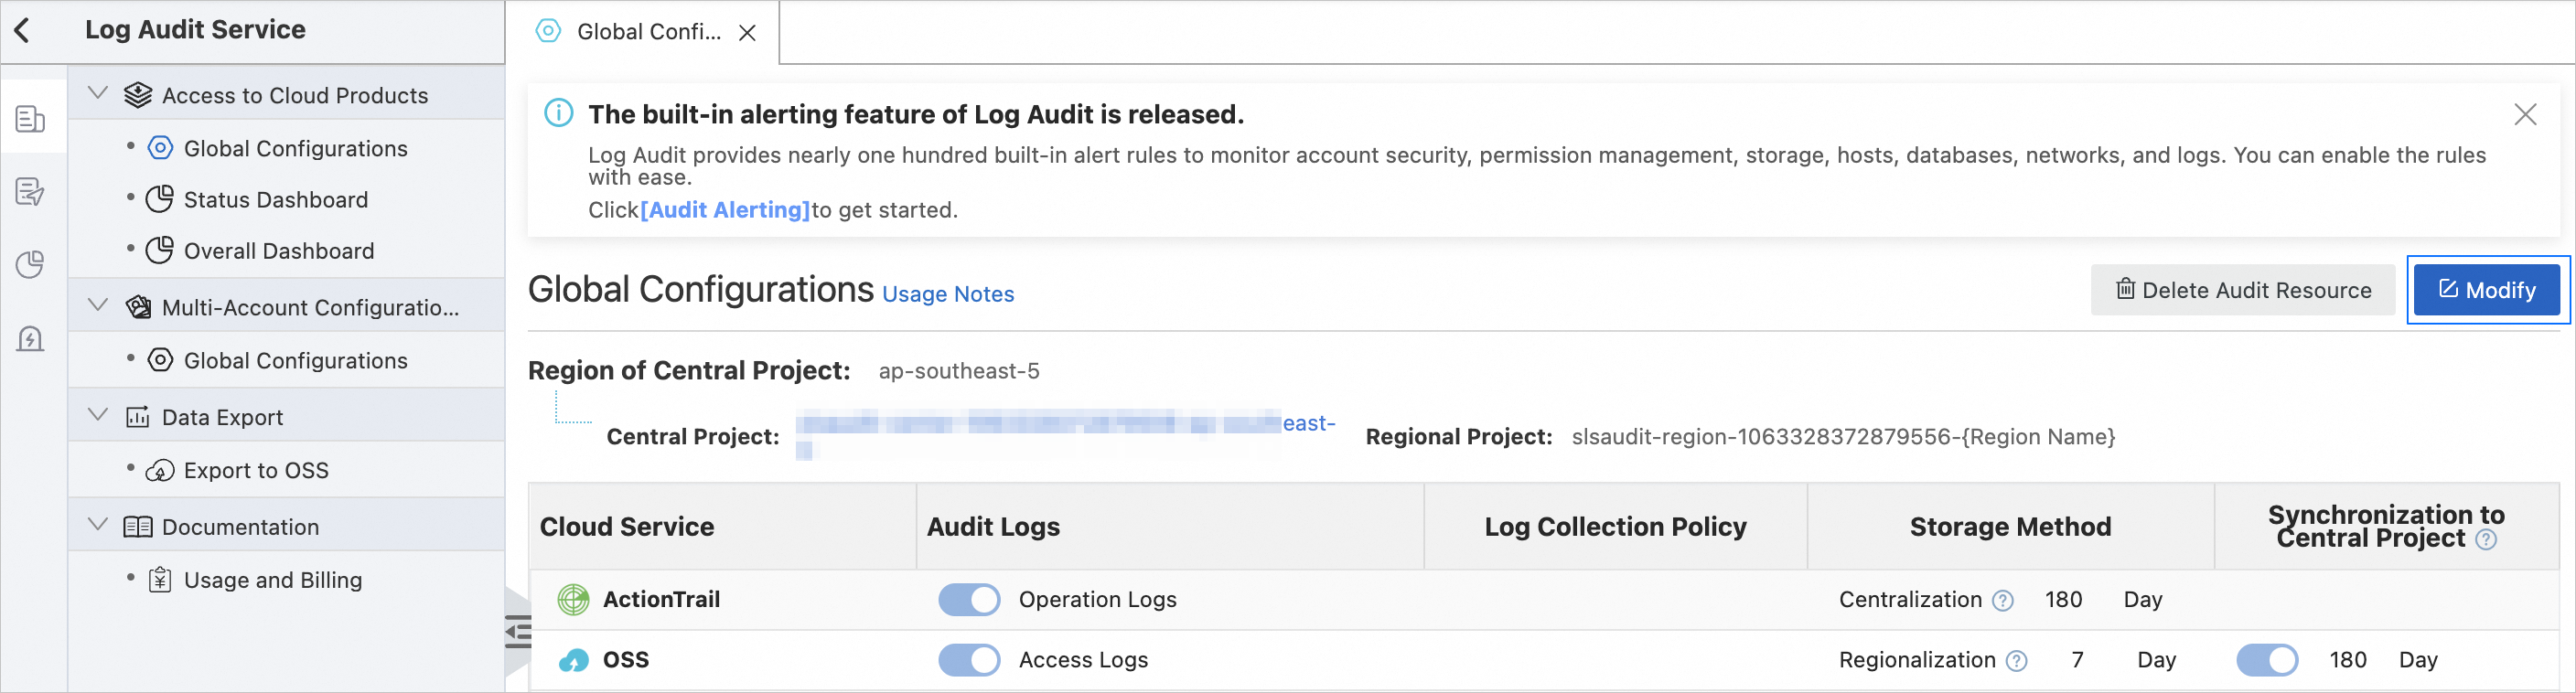
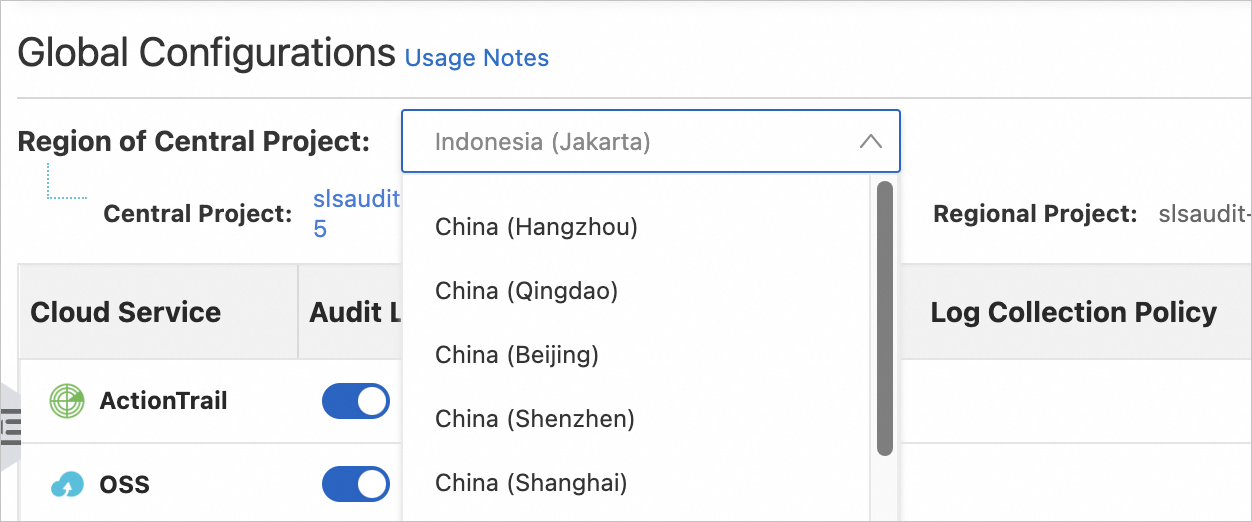
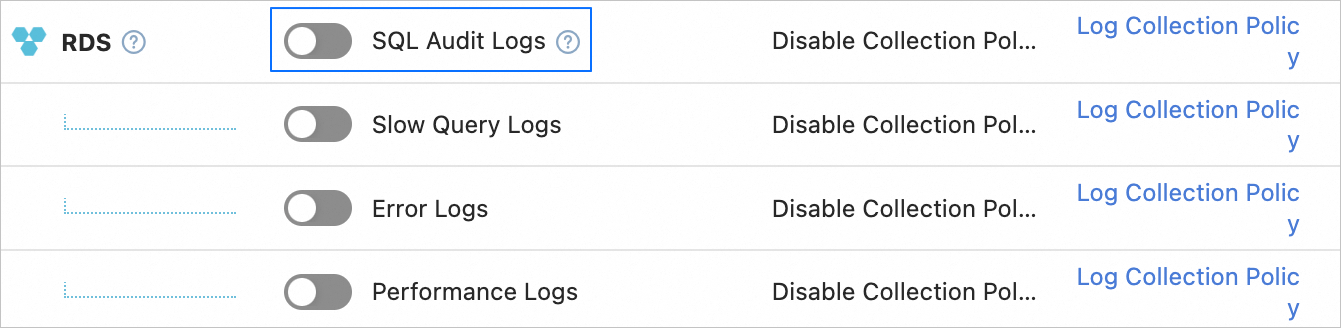

After confirming the content in the Prompt dialog box, click Configure Collection Policy.
In the Collection Policy Configuration dialog box, configure the collection policy.
Log Service supports configuring collection policies through either Default Collection Policy or Advanced Editing Mode. For more information, see Configure log collection policies.
Notice
If you configure the Default Collection Policy, it will collect all instances across all regions by default, which may result in unexpected costs. We recommend that you use Advanced Editing Mode to configure data collection for specific instances that need replay.

In the Policies to Add section, select Instance ID as the attribute, Exact Match as the operator, and enter the RDS MySQL instance ID or PolarDB MySQL instance ID for log collection in the text box on the right.
This attribute configuration is an example. You can modify it according to your actual needs.
Click Add Policy at the bottom right of the dialog box.
After confirming the configuration is correct, click OK.
Return to the Global Configurations page, click OK, and wait for the configuration to complete.
Obtain the traffic files of an instance
You can obtain the traffic files of the target instance by saving the traffic files in Log Service SLS to Alibaba Cloud OSS and downloading the SQL audit logs to your local device. When you create a performance assessment task, the Configure Data Collection page displays the Data Collected From. The options are Import Object Storage (OSS) and Upload File.
If you save the traffic files in Log Service SLS to Alibaba Cloud OSS, select Import Object Storage (OSS) to import the traffic files for assessment.
If you download the SQL audit logs to your local device, select Upload File to import the traffic files for assessment.
Save the traffic files in SLS to OSS
Notice
Migration assessment supports only real-time traffic files. It does not support traffic files that are supplemented from SLS. For example, if you enable OSS traffic delivery after two hours of enabling SLS log monitoring, the migration assessment does not receive traffic files before the two hours.
Return to the Log Service console.
In the Projects section, click the target Project name to enter the Logstore page.
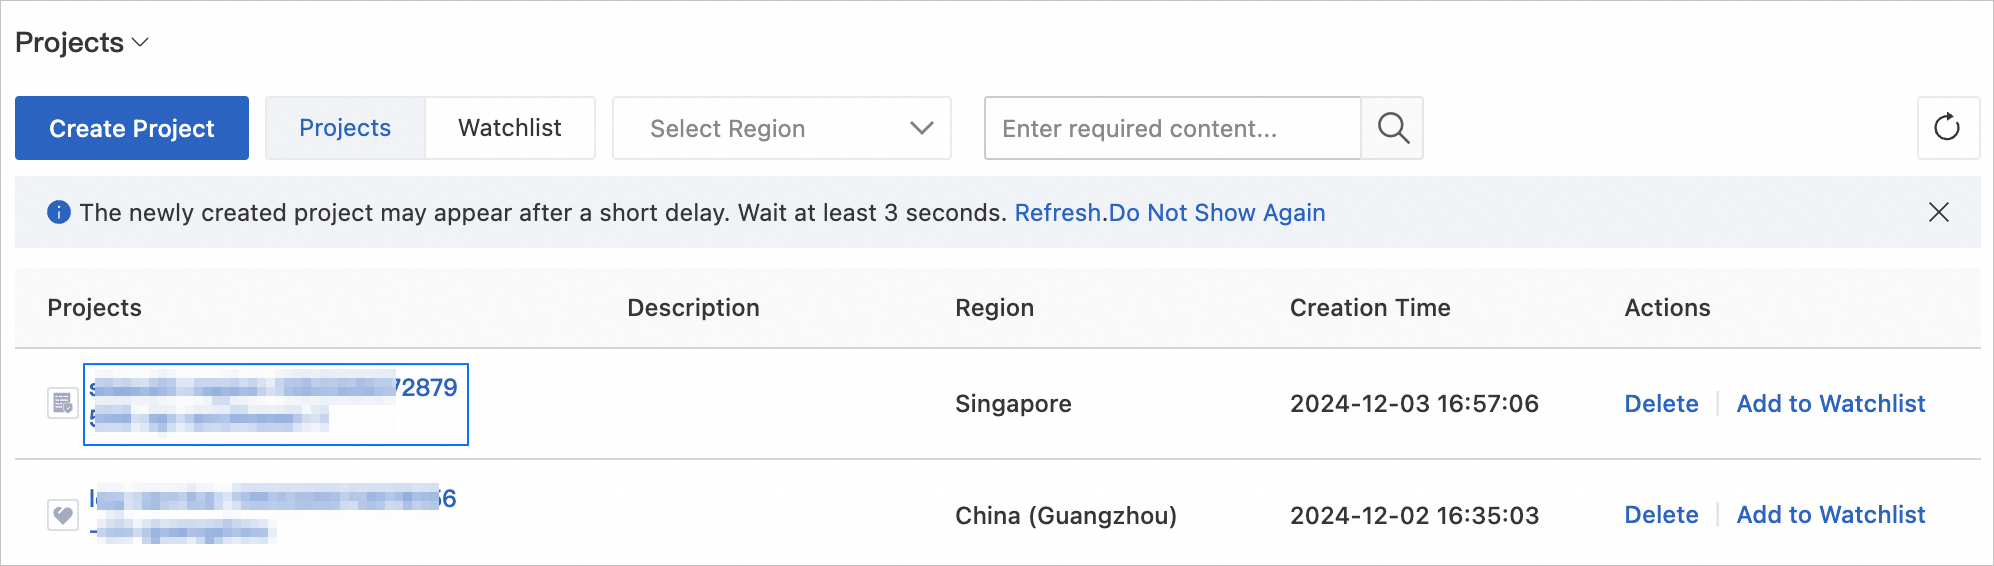

In the Create Delivery Task dialog box, select OSS Export and click OK.
In the OSS Delivery dialog box, configure the parameters and export the logs to Alibaba Cloud OSS. For more information, see Create an OSS delivery task (new).
Notice
When you configure parameters in the OSS Delivery dialog box, observe the following rules:
- File Directory: Required.
- Partition Format: %Y/%m/%d/%H/%M.
- Storage Format: Only JSON is supported.
- Compression: Only Snappy is supported.
After the parameters are configured, click OK.
Download SQL audit logs
Return to the Log Service console.
In the Projects section, click the target Project name to enter the Logstore page.
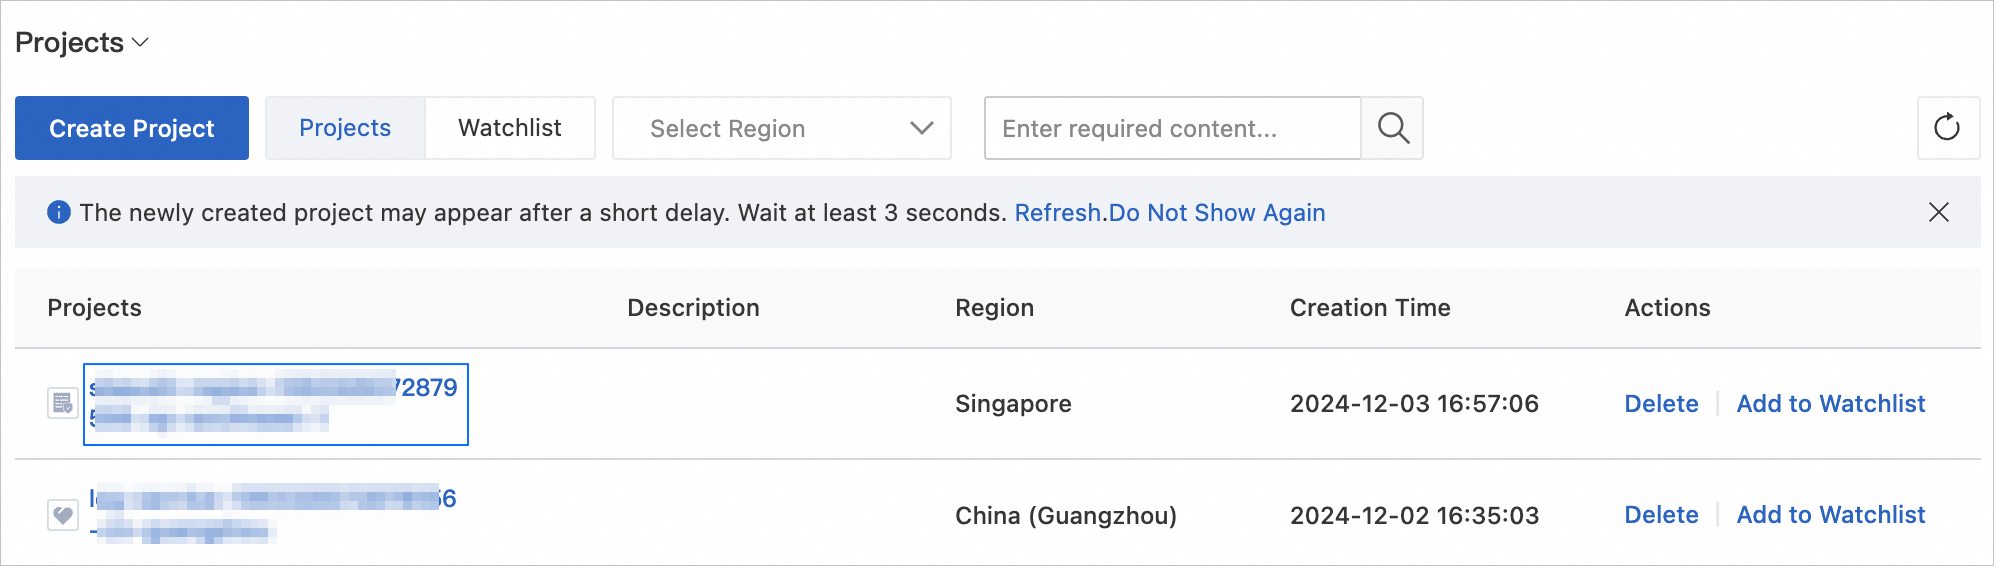
In the left navigation pane, click the target Logstore name to open the log details page.
For more information on creating a Logstore, see Manage a logstore.
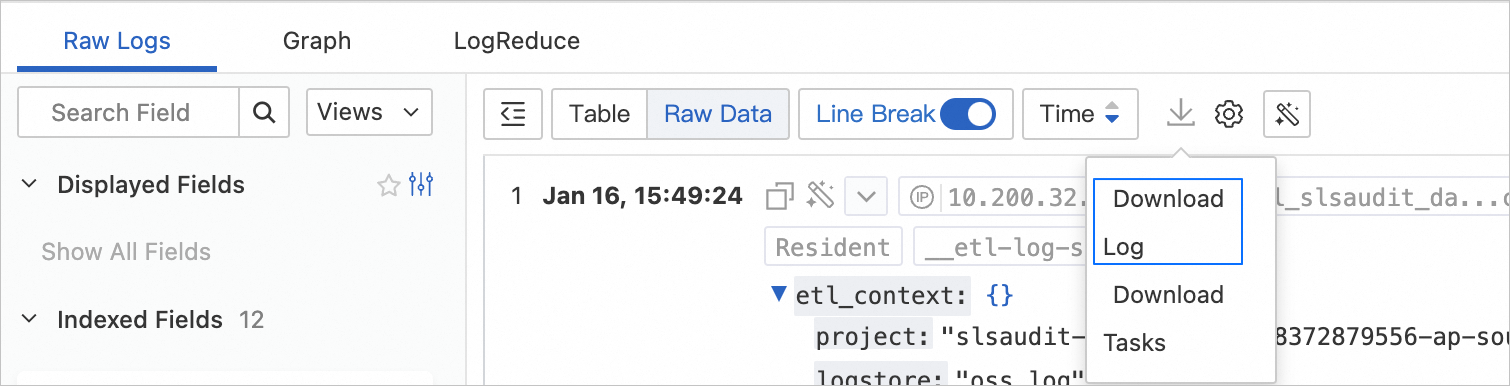
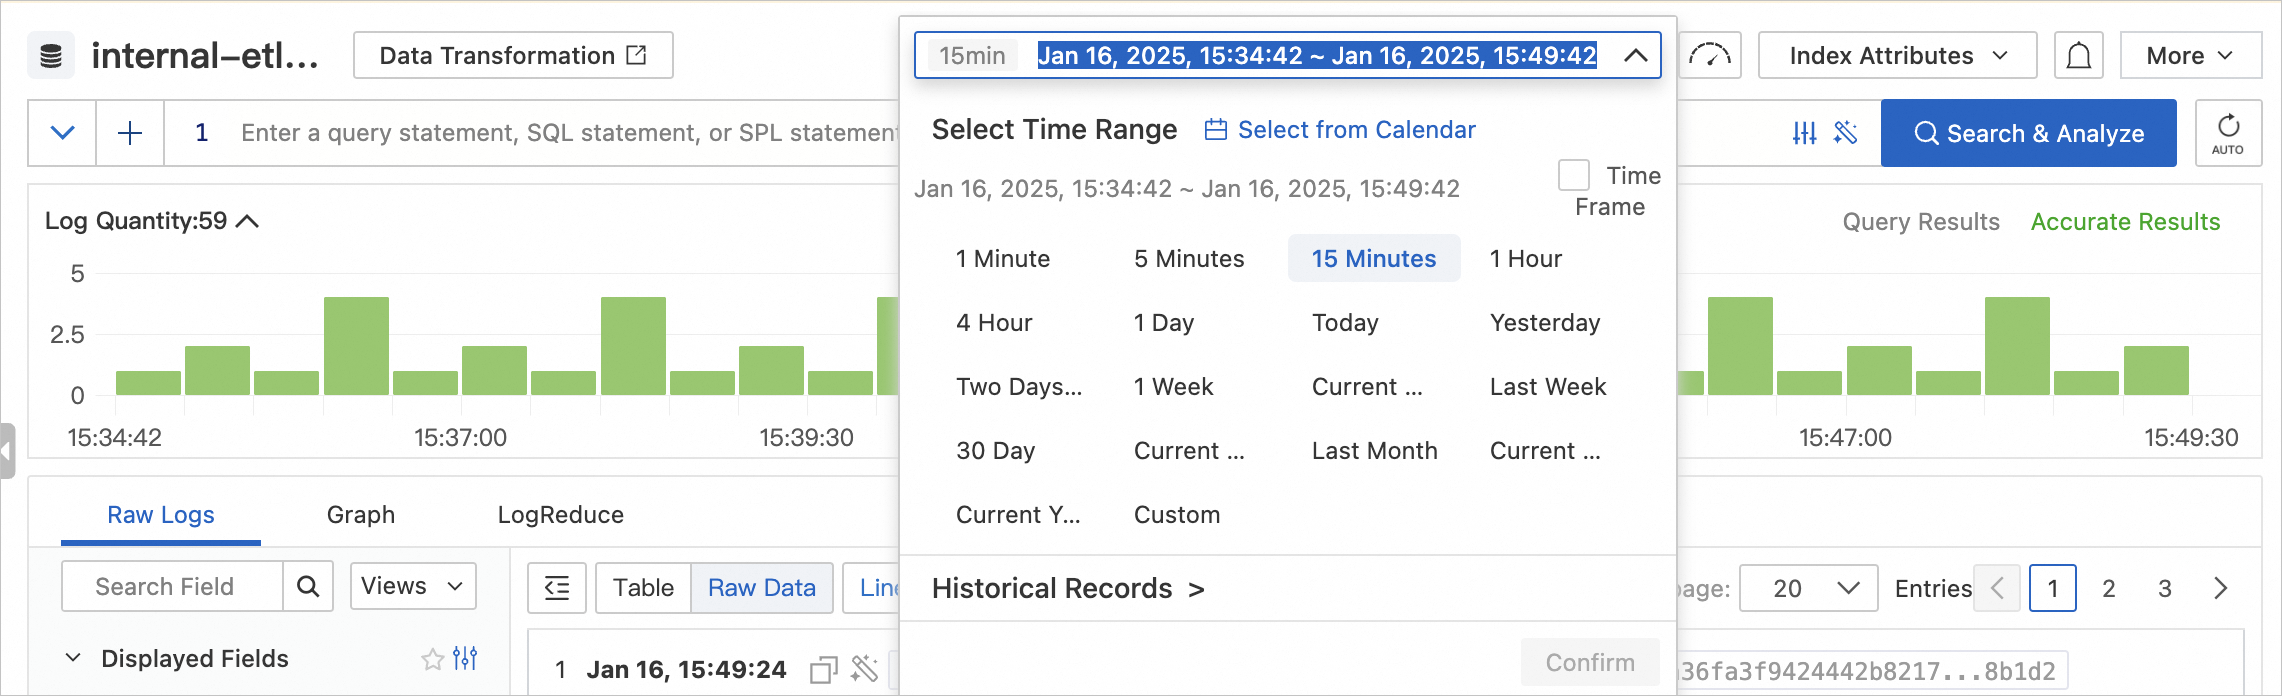
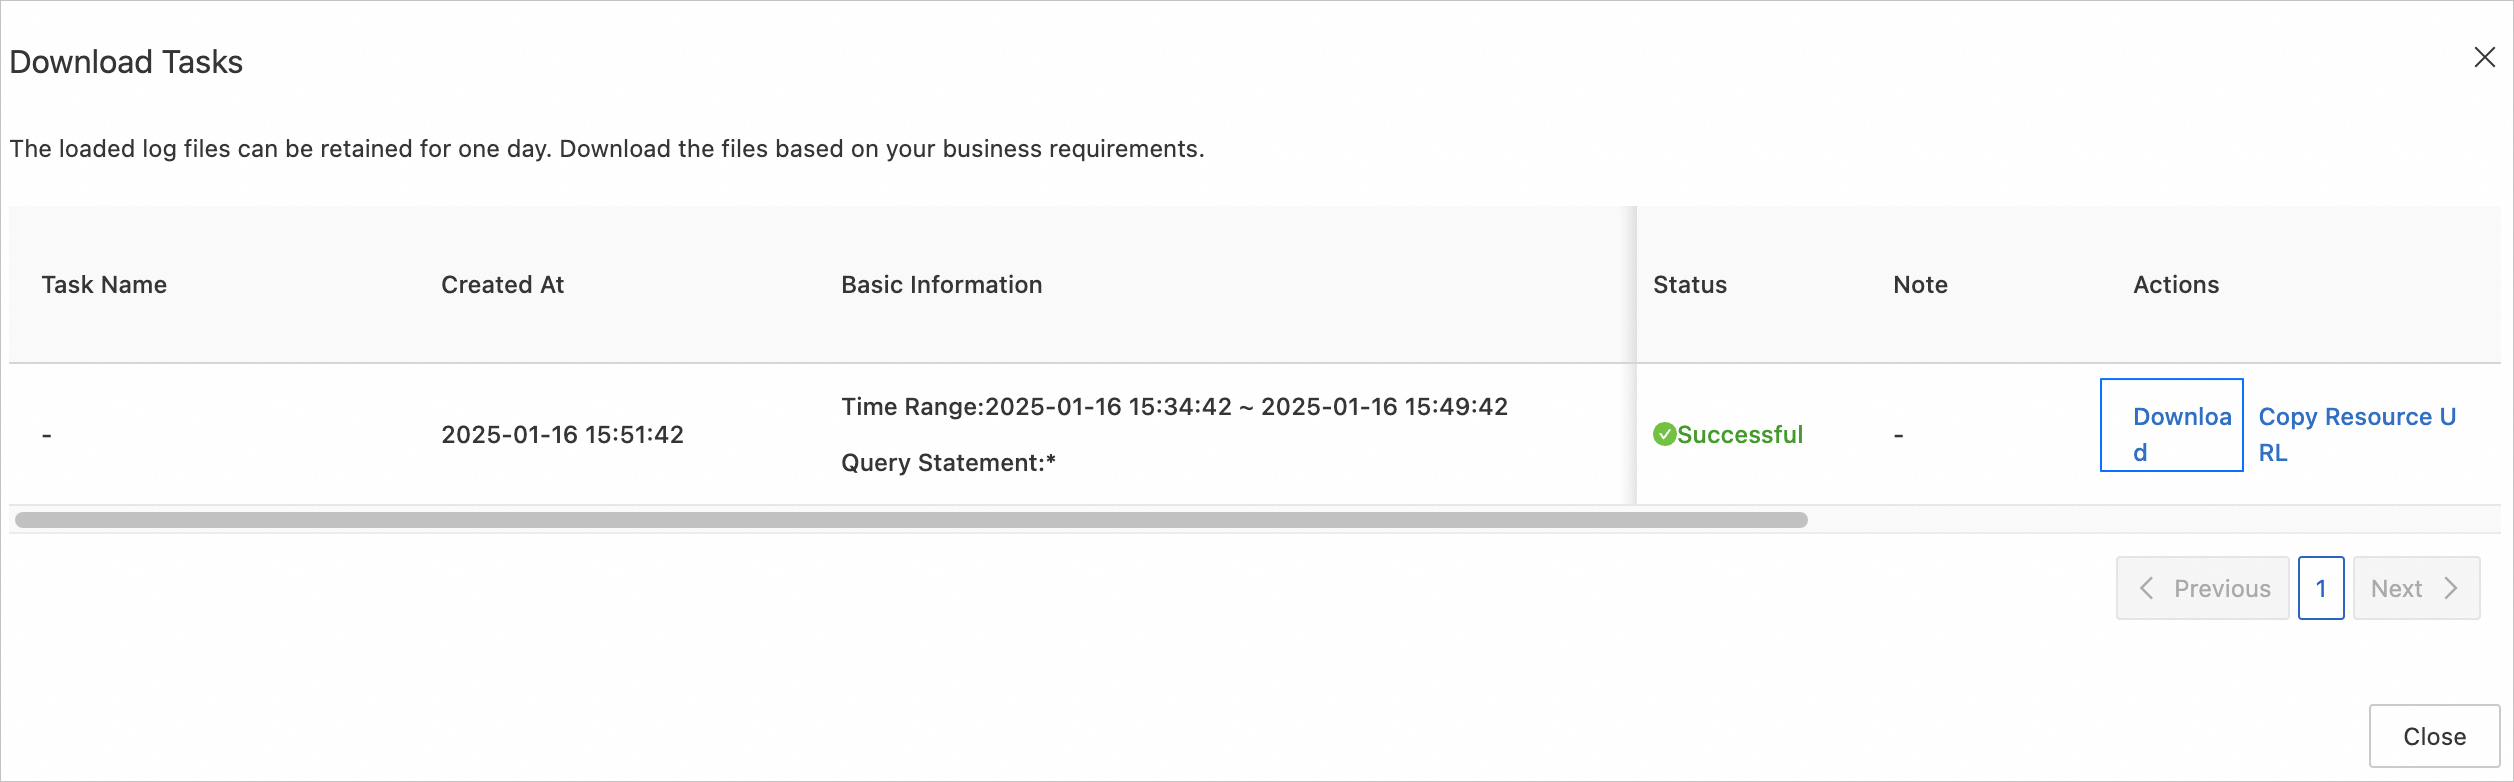
In the Download Log dialog box, select Offline Download and configure the parameters.
Note
Currently, only
gzipcompression is supported.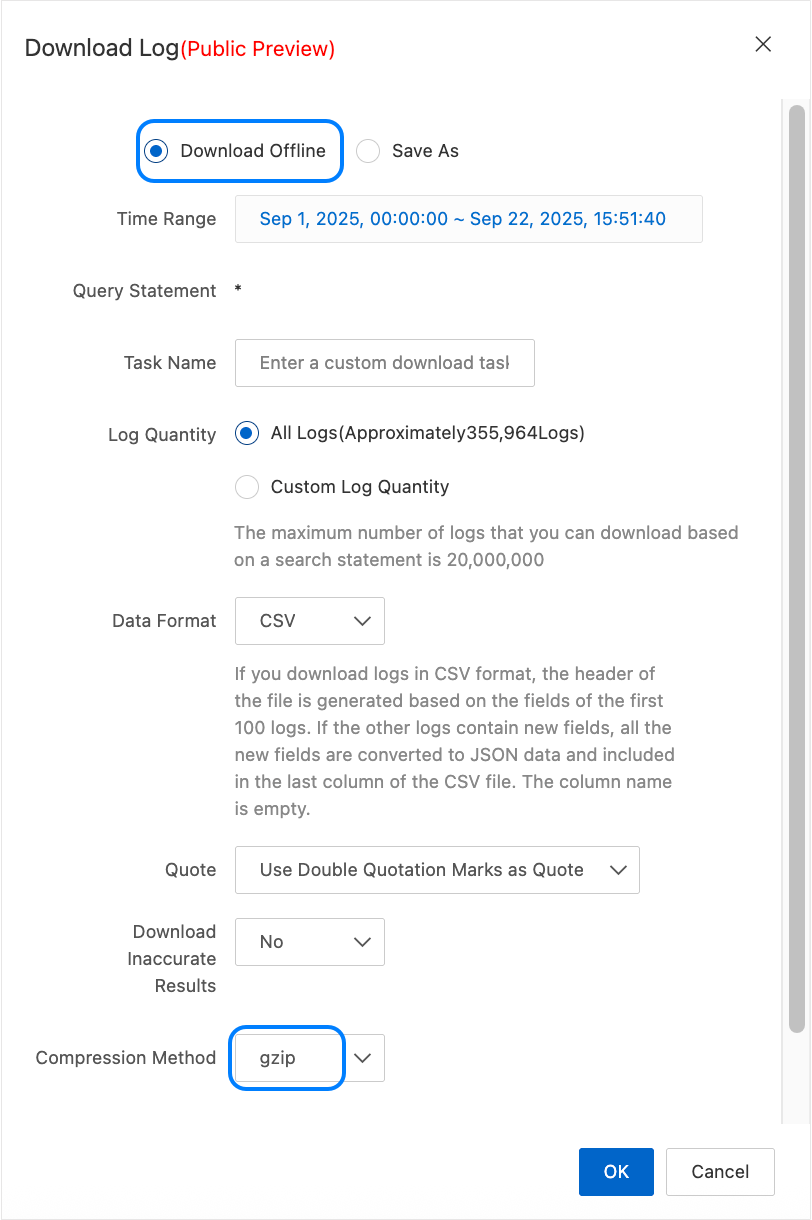
After configuration, click OK.
Create a database instance
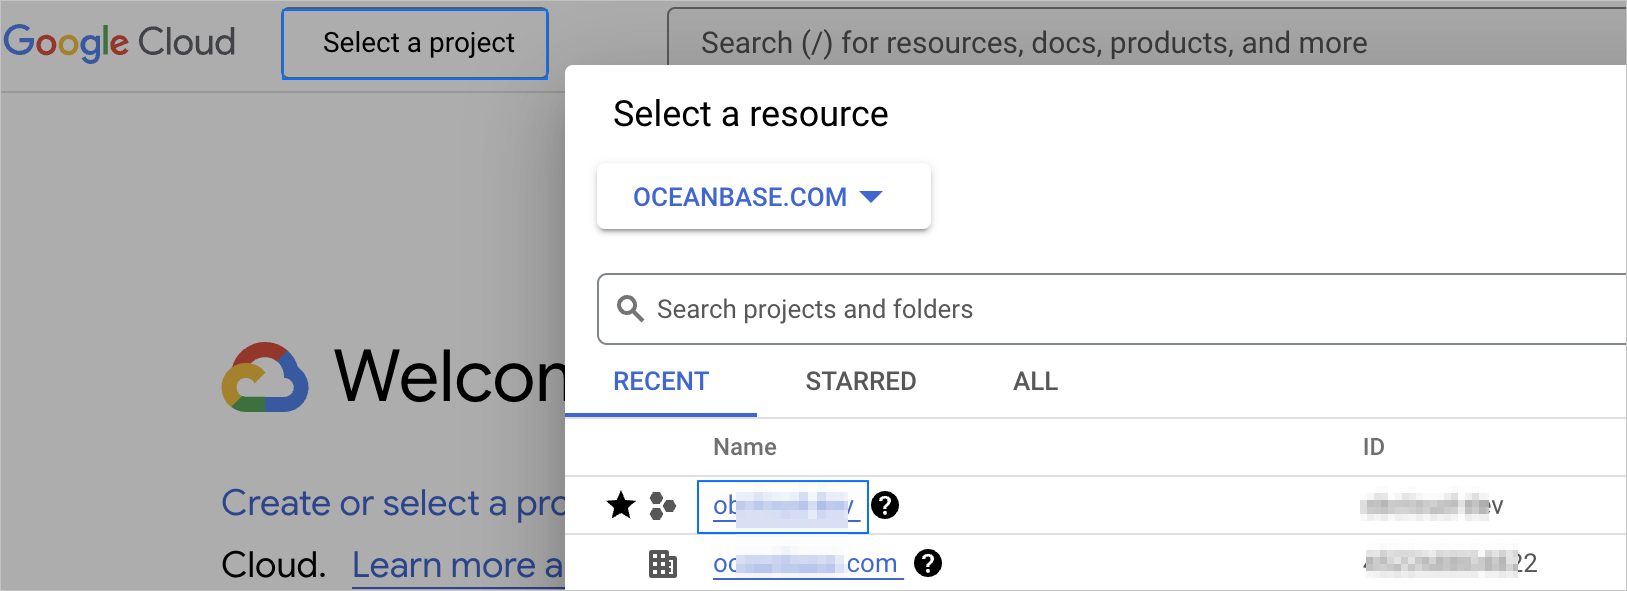
Log in to the Google Cloud Console.
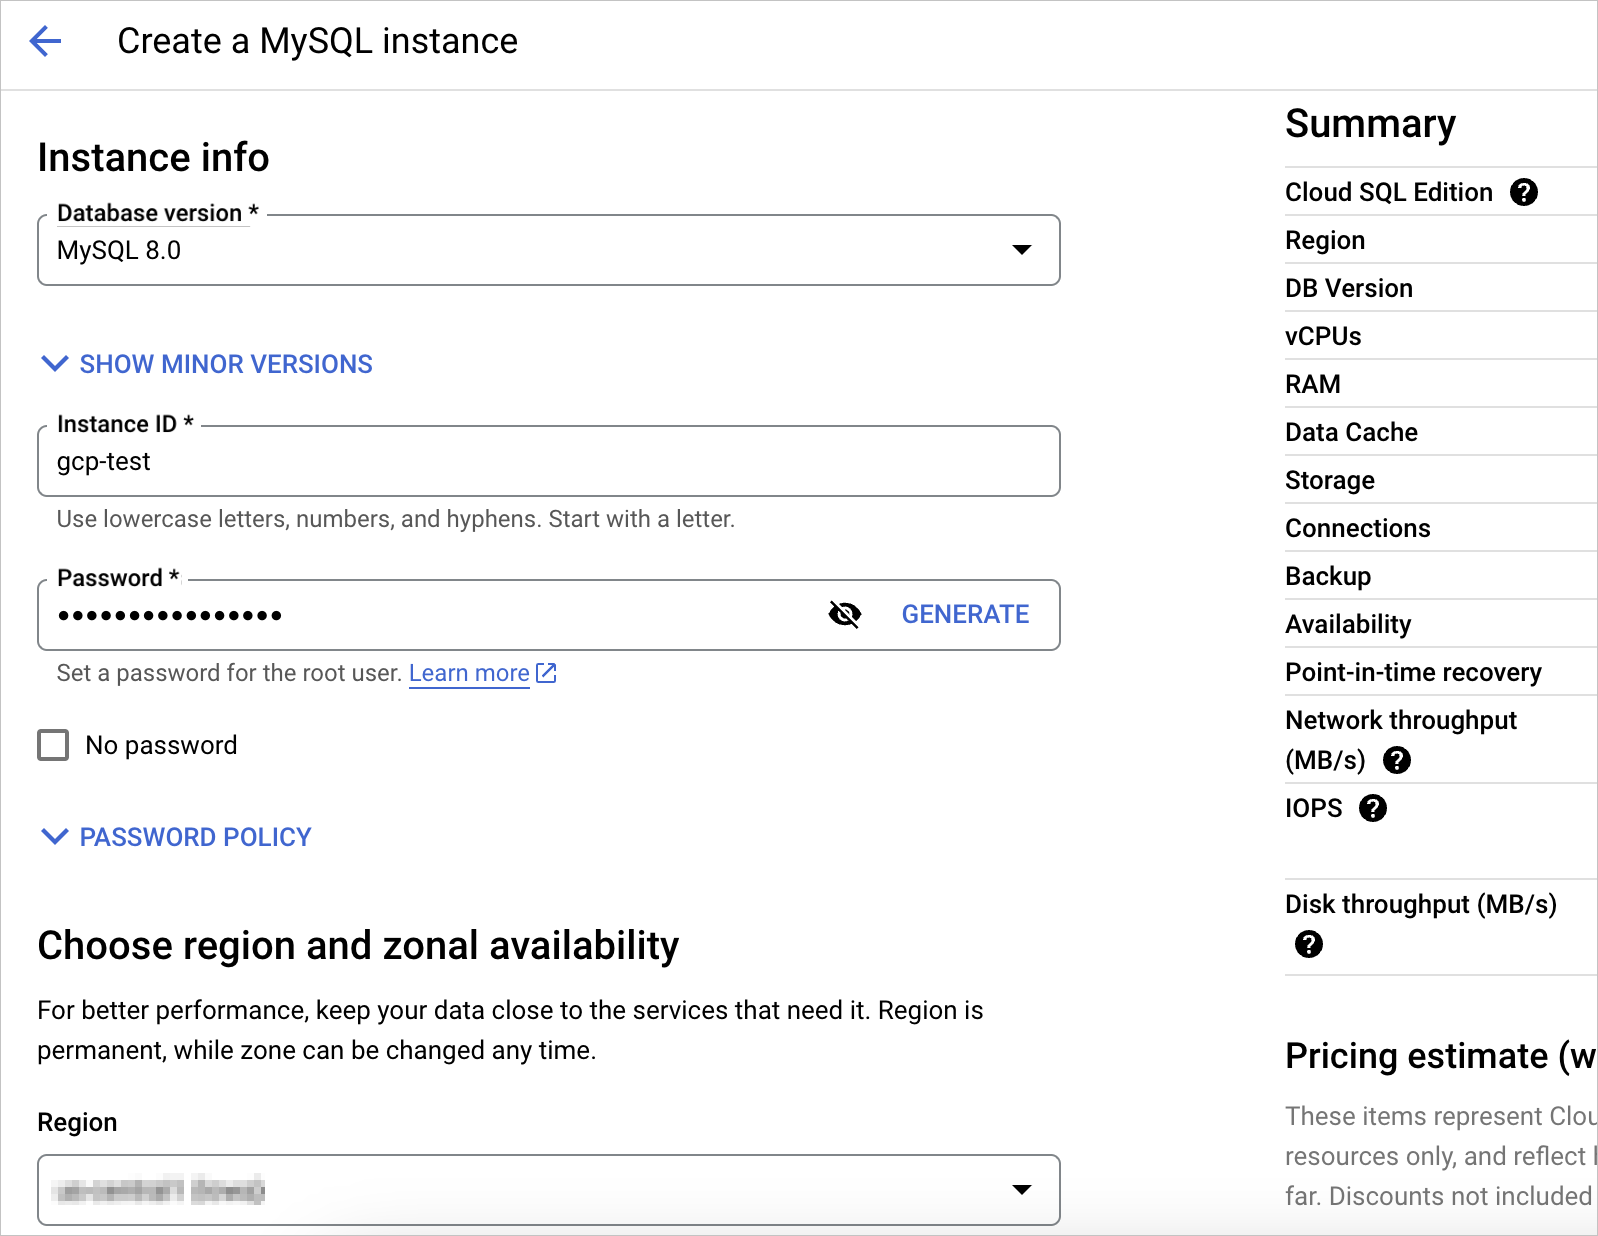
Add database flags for exporting audit logs.
In the Customize your instance section, click SHOW CONFIGURATION OPTIONS.
Expand the Flags option, click ADD A DATABASE FLAG.
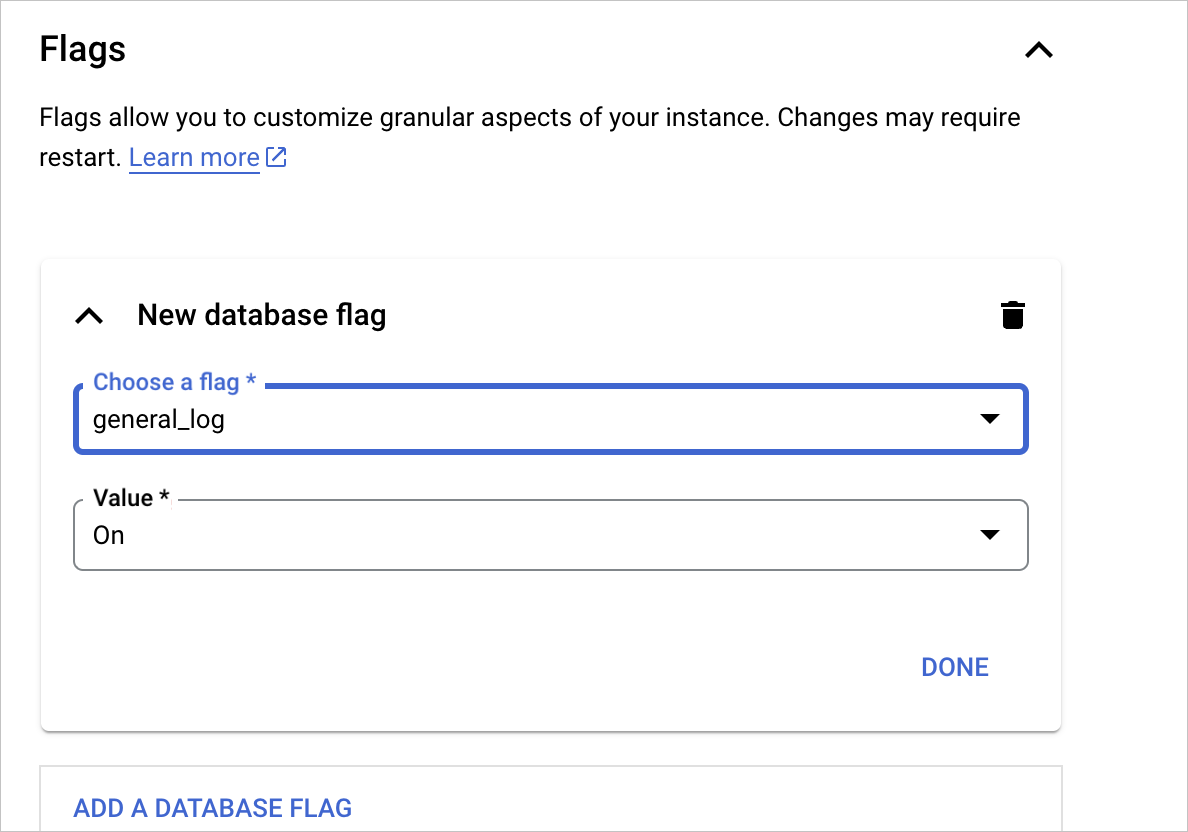
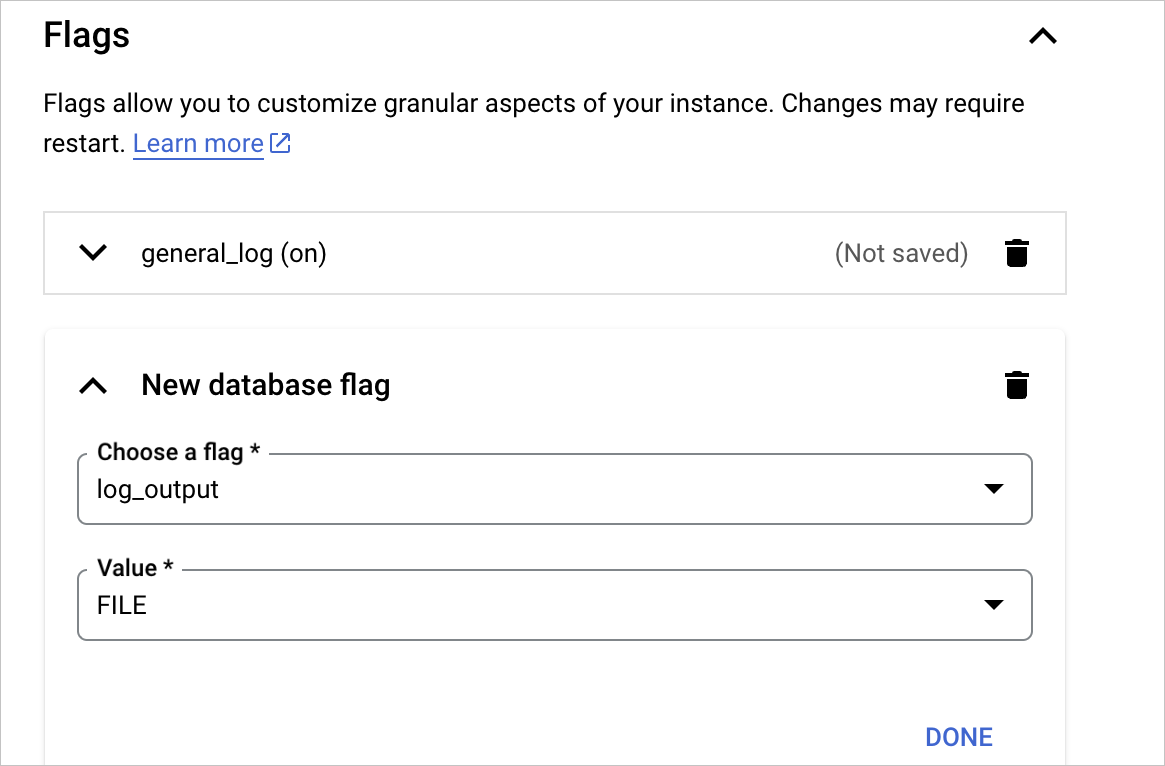
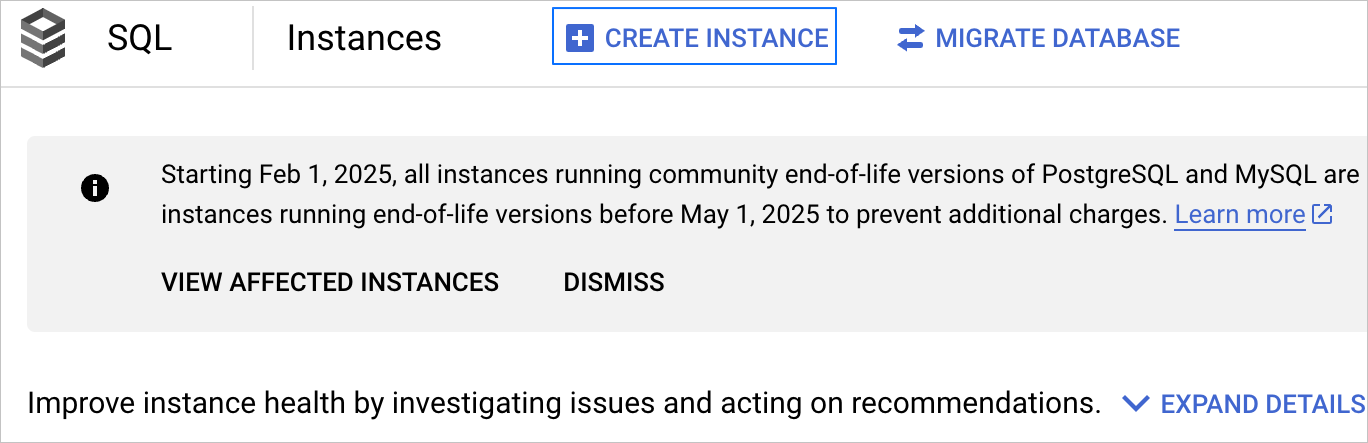
Click CREATE INSTANCE.
After creation, add the source IP/IP range to the database's authorized network list.
Return to the Cloud SQL Console homepage, click the target instance name to enter the instance details page.
Click Connections in the left navigation bar.
On the Connections page, click the NETWORKING tab.
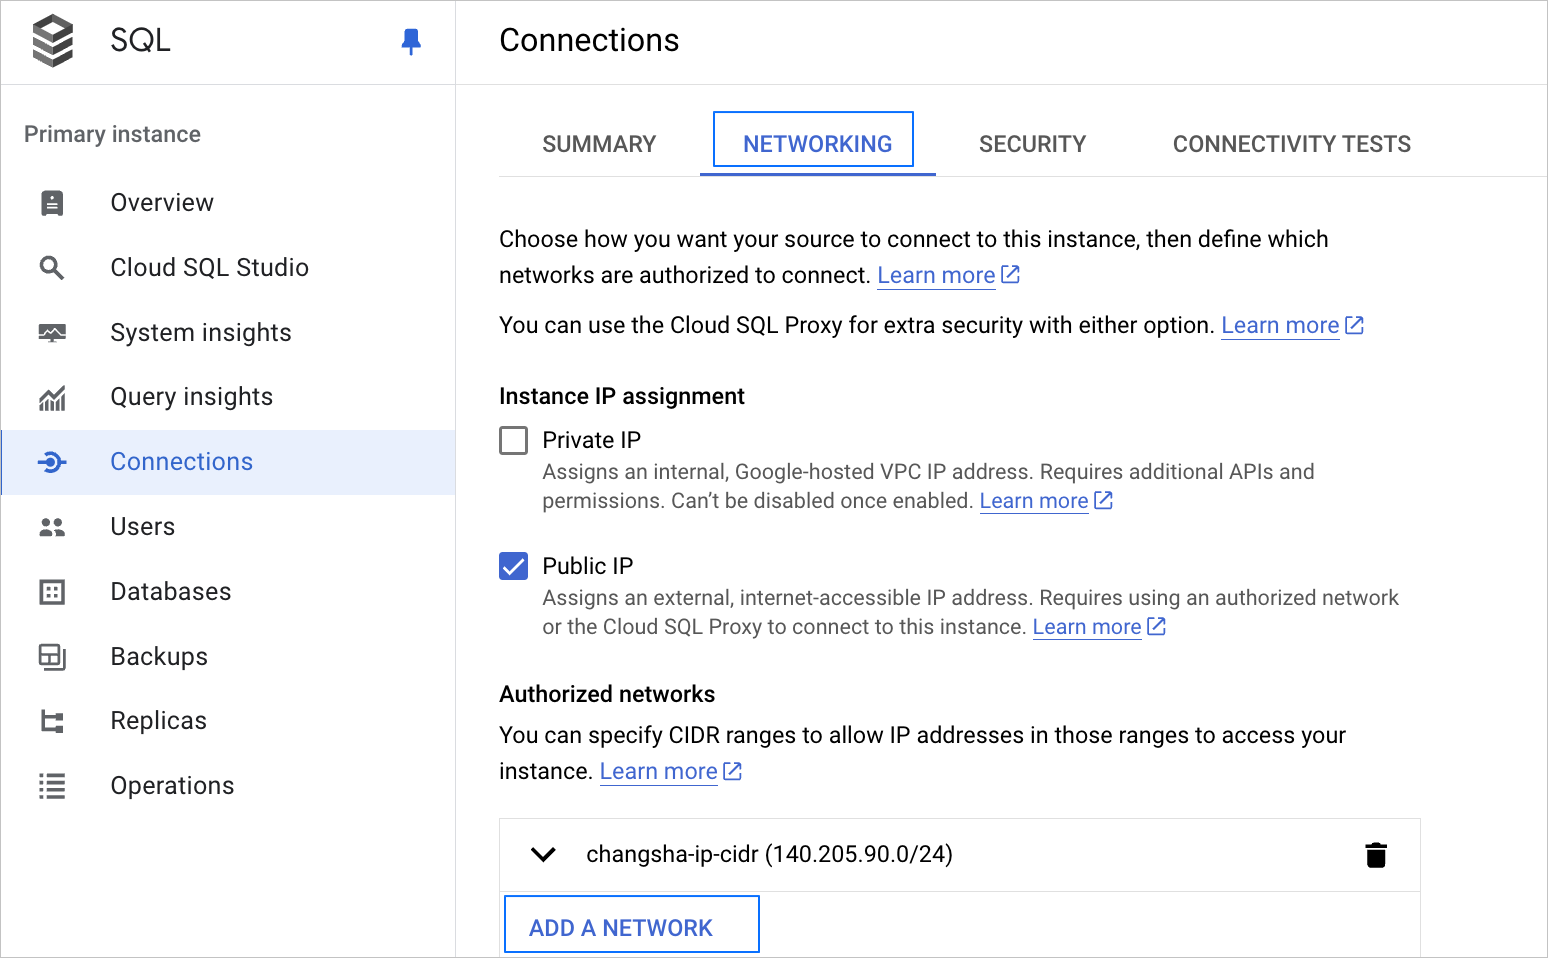
In the New network dialog box, enter the network name and source IP/IP range, click DONE.
Click SAVE at the bottom of the Connections page.
Create databases and users on the Cloud SQL instance (optional). For more information, see Create and manage databases and Create a user.
Create storage bucket and obtain AK/SK
Log in to the Cloud Storage Console of the corresponding project.
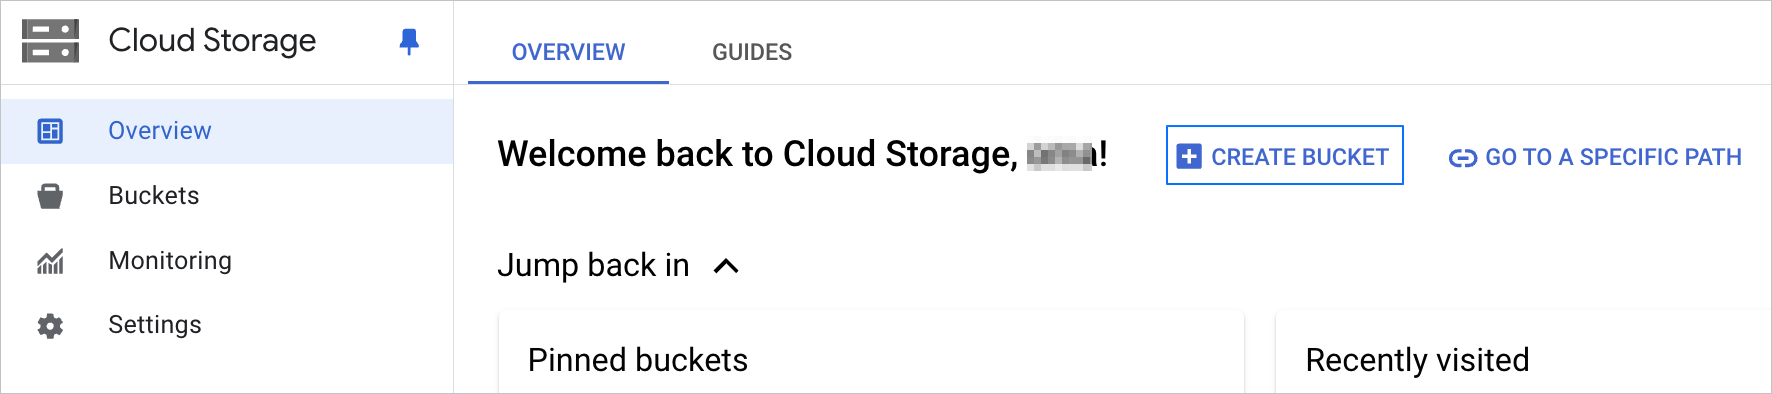
Configure the information on the Create a bucket page.
In the Obtain Started section, enter a globally unique permanent name that complies with naming guidelines, decide whether to enable namespace hierarchy and add labels based on actual needs, then click CONTINUE.
In the Choose where to store your data > Location type section, select Region, choose the corresponding region from the dropdown list, then click CONTINUE.
In the Choose a storage class for your data > Set a default class section, select Standard, click CONTINUE.
In the Choose how to control access to objects > Access control section, select Uniform, click CONTINUE.
Click CREATE at the bottom of the page.
After creation, obtain the Cloud Storage AK/SK. For more information, see Create AccessKeys.
Create log router
Go to the Logs Explorer Console.
Select log source.
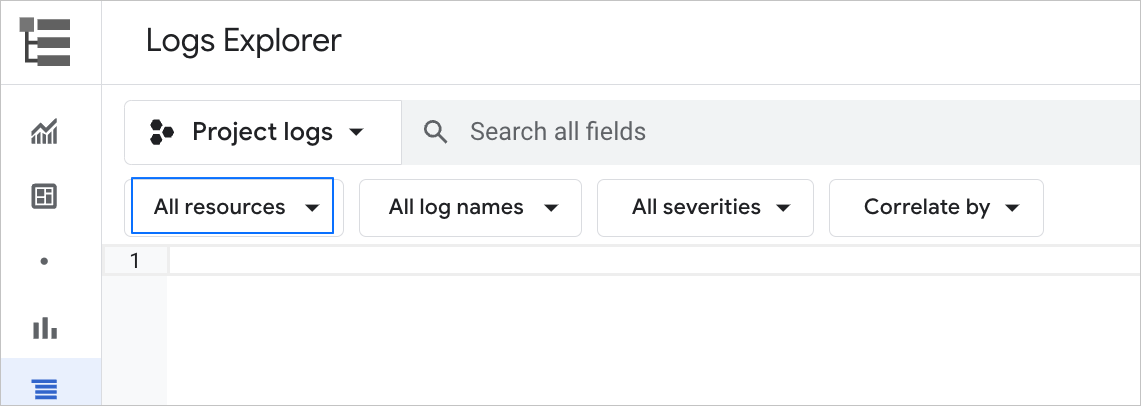
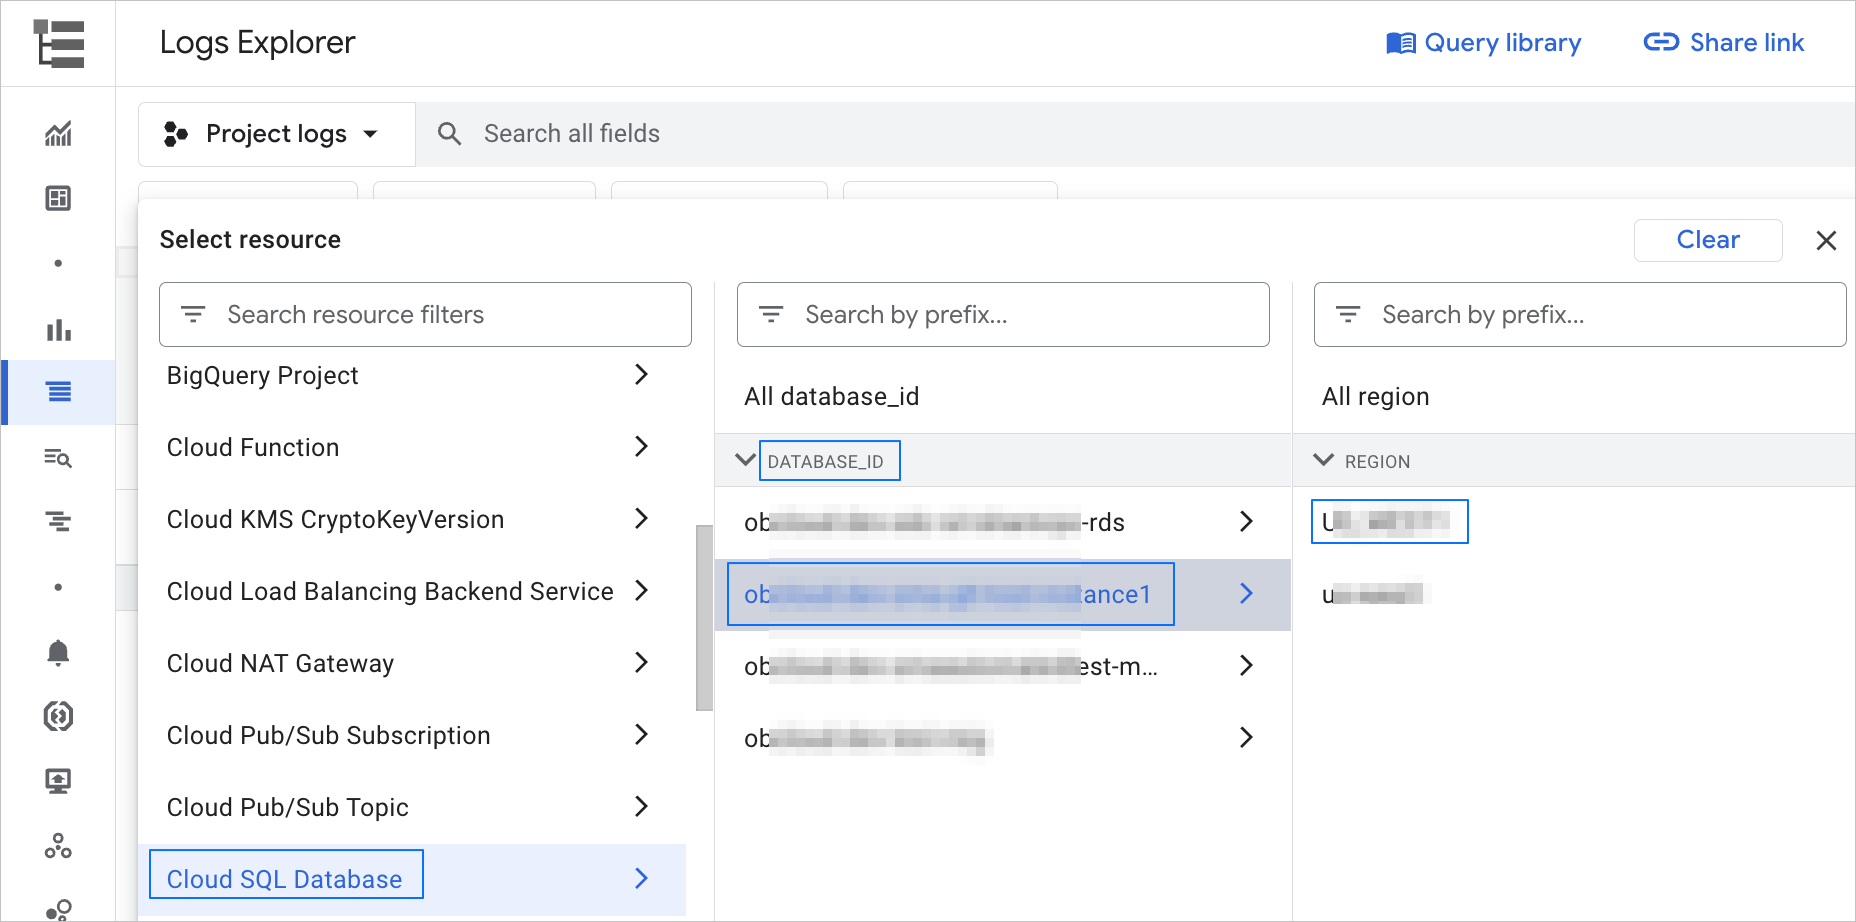
- Click Apply.
Select the corresponding log type file.
On the Logs Explorer page, click All log names.
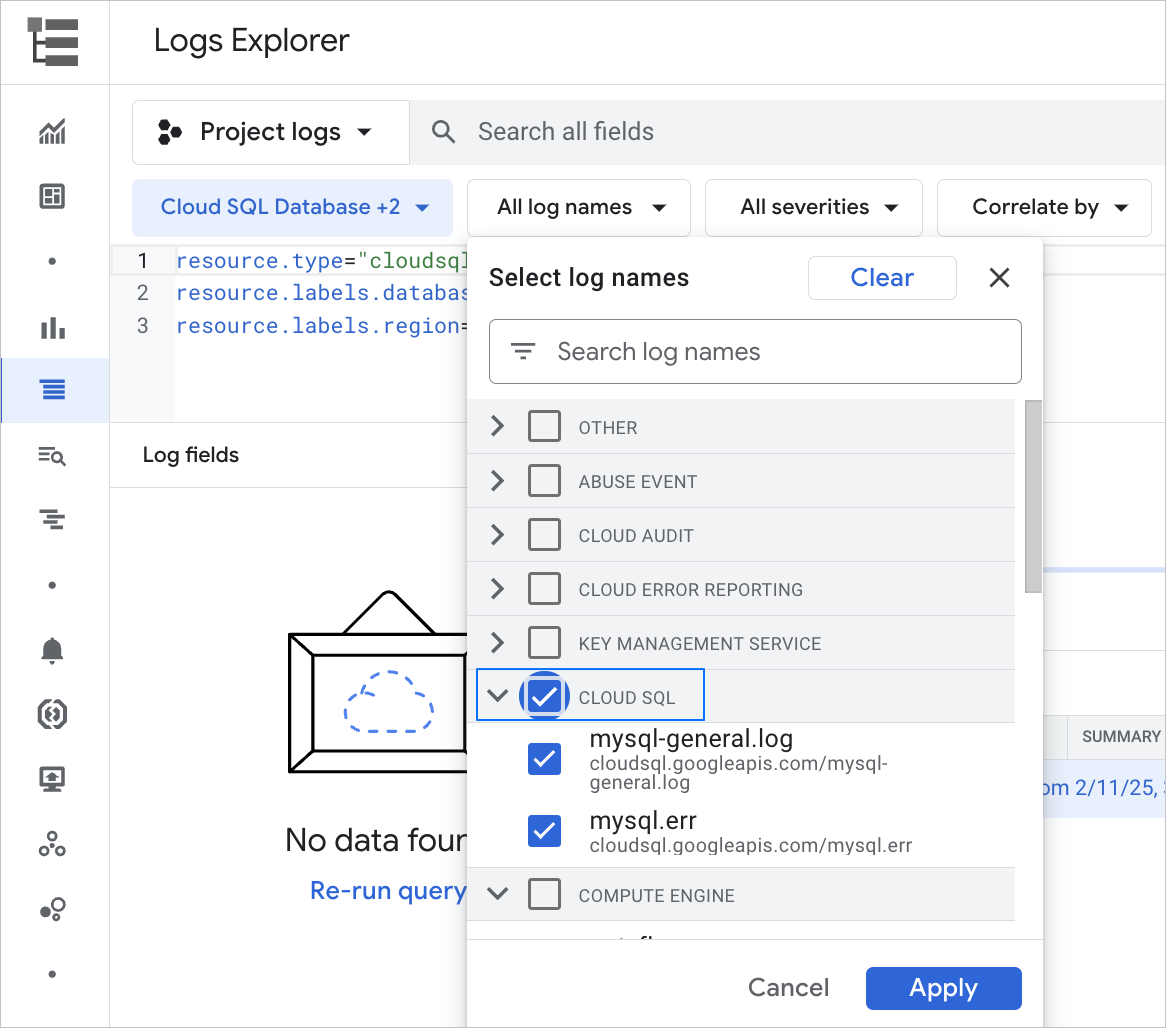
Click Apply.

Create a log router to route logs to Cloud Storage.
Go to the Log Router Console.
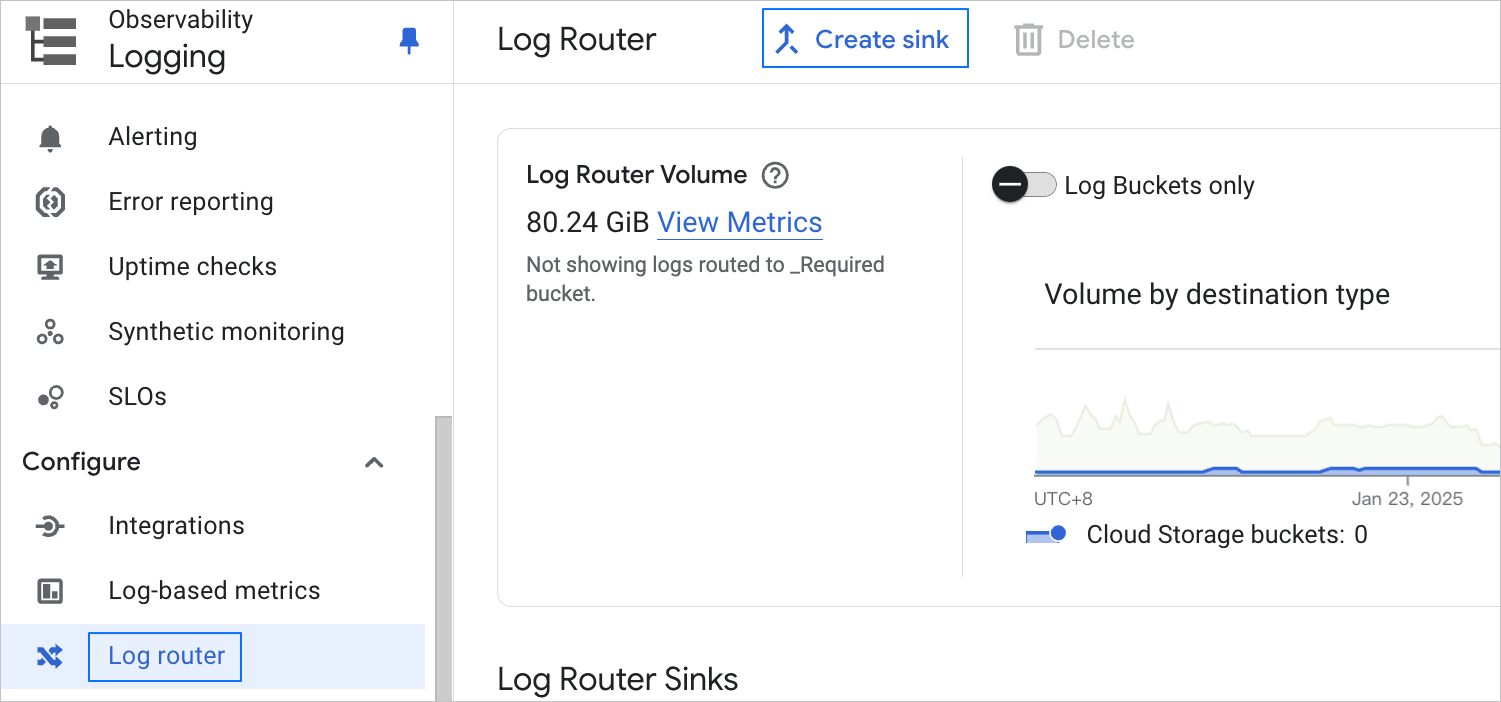
Configure parameters on the Create logs routing sink page.
In the Sink details section, enter the sink name and description. Click Next.
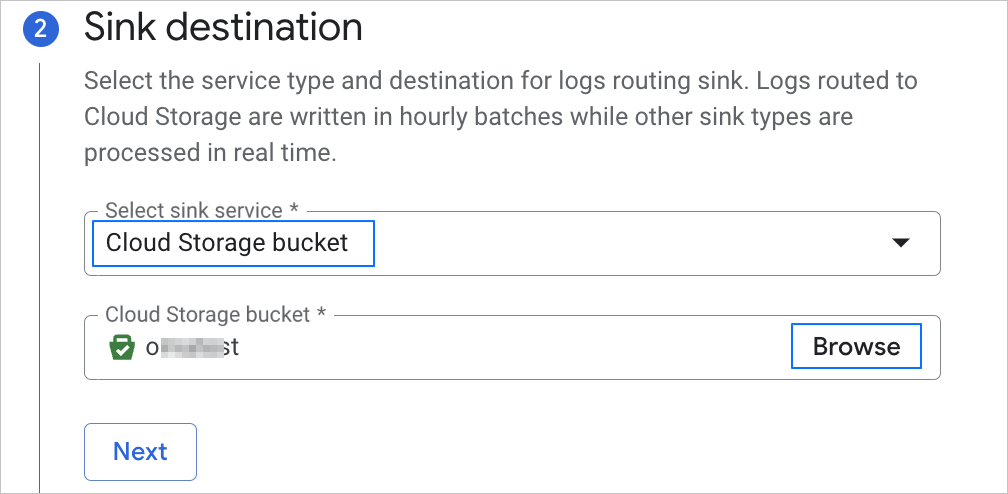
In the Choose logs to include in sink section, paste the command line copied from the Logs Explorer page. Click Next.
Click Create sink at the bottom of the page.