


This topic describes how to create and manage dashboards in a workspace.
Background information
The OceanBase Cloud dashboard allows you to monitor and analyze massive amounts of data in real time, helping you better understand your business and improve your operational efficiency and decision-making capabilities. The dashboard provides data visualization features, converting complex data into easy-to-understand charts, to help you better understand and utilize the data.
The example below will guide you through the process of creating a workspace, a dashboard named test_employee, and adding a bar chart named bar_employee to the dashboard.
Note
All data used in this example is for reference only. You can replace the data as needed.
Procedure
Step 1: Create a dashboard
Log in to the OceanBase Cloud console. In the left-side navigation pane, click Instances to create an analytical instance and a super administrator account.
In the workspace list, click the name of the target workspace to go to the corresponding workspace.
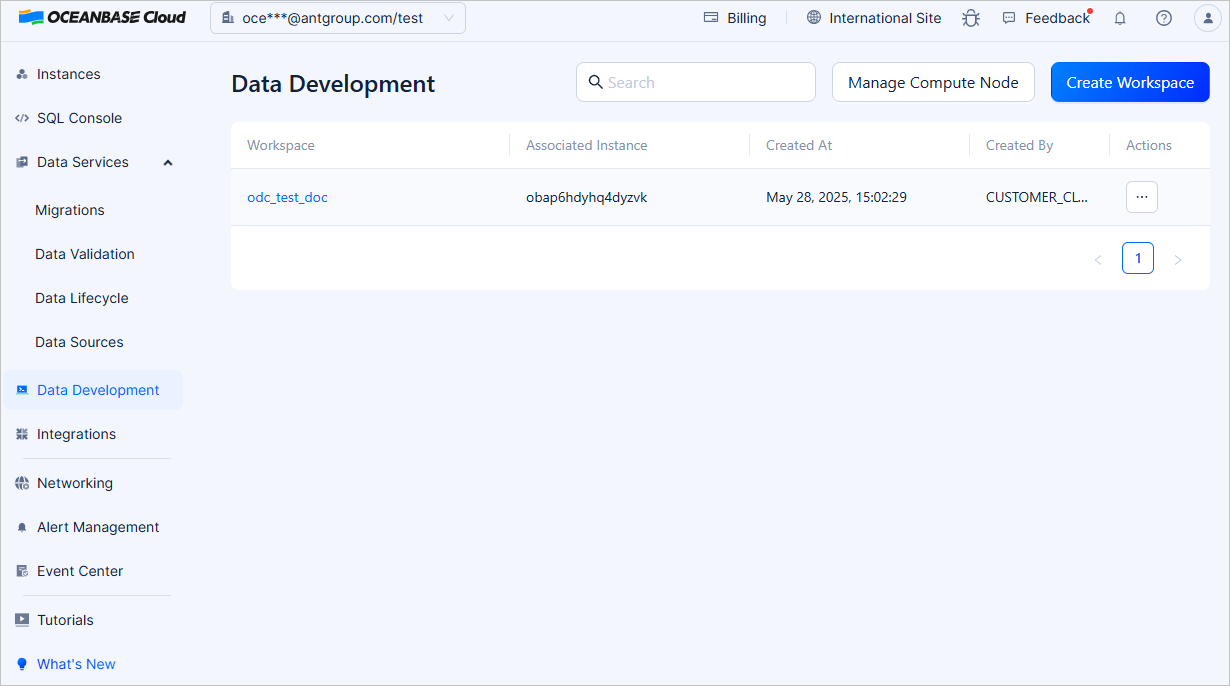
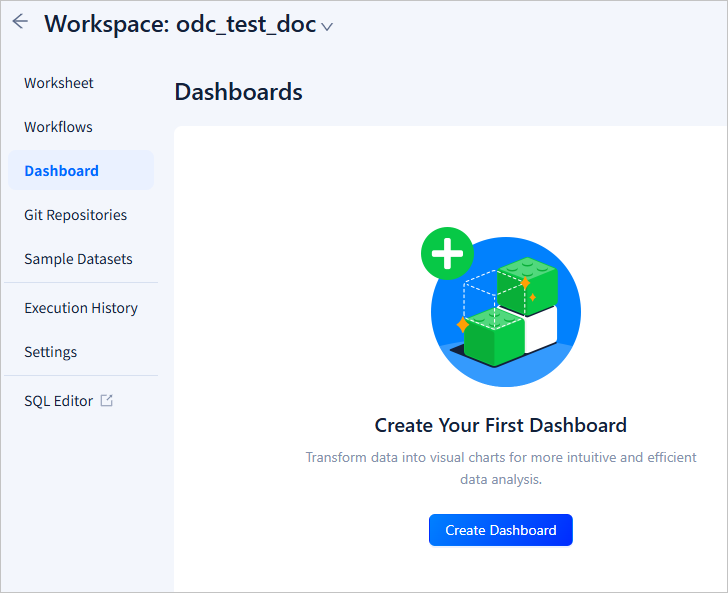
In the left-side navigation pane of the workspace page, click Dashboards. On the dashboard page, click Create Dashboard to create a dashboard.
Step 2: Add a chart to the dashboard
You can add a chart to the dashboard or use a chart from the result tab of a SQL statement execution.
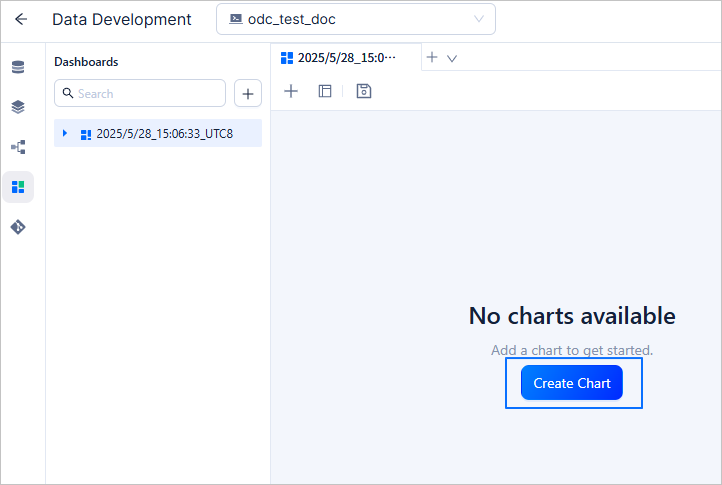
Open the created dashboard and click Create Chart to add a chart to the dashboard.
Note
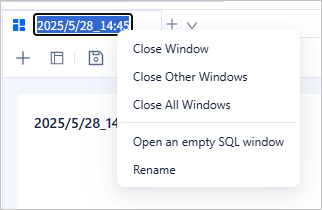
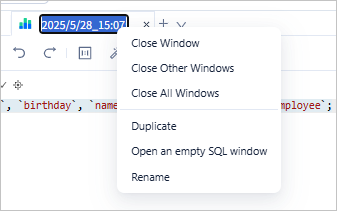
You can double-click or right-click the name of a dashboard in the SQL window to rename the dashboard.
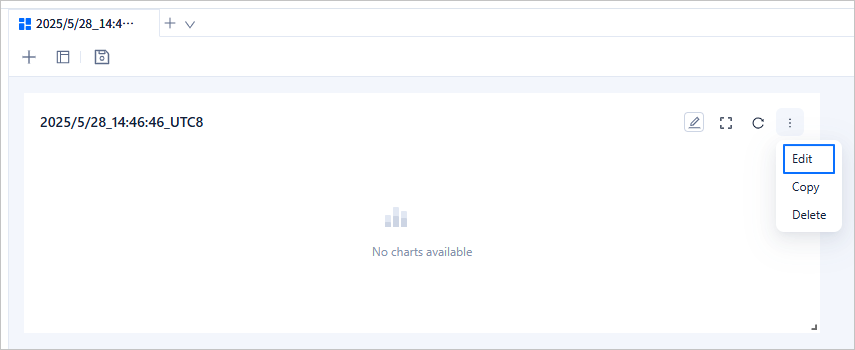
In the newly created chart, click the more icon and then click Edit.
Click the Data Source icon in the toolbar to switch to the
test1database. Then, edit and execute the SQL statement to query data in theemployeetable.SELECT `emp_no`, `birthday`, `name`, `salary`, `time` FROM `employee`;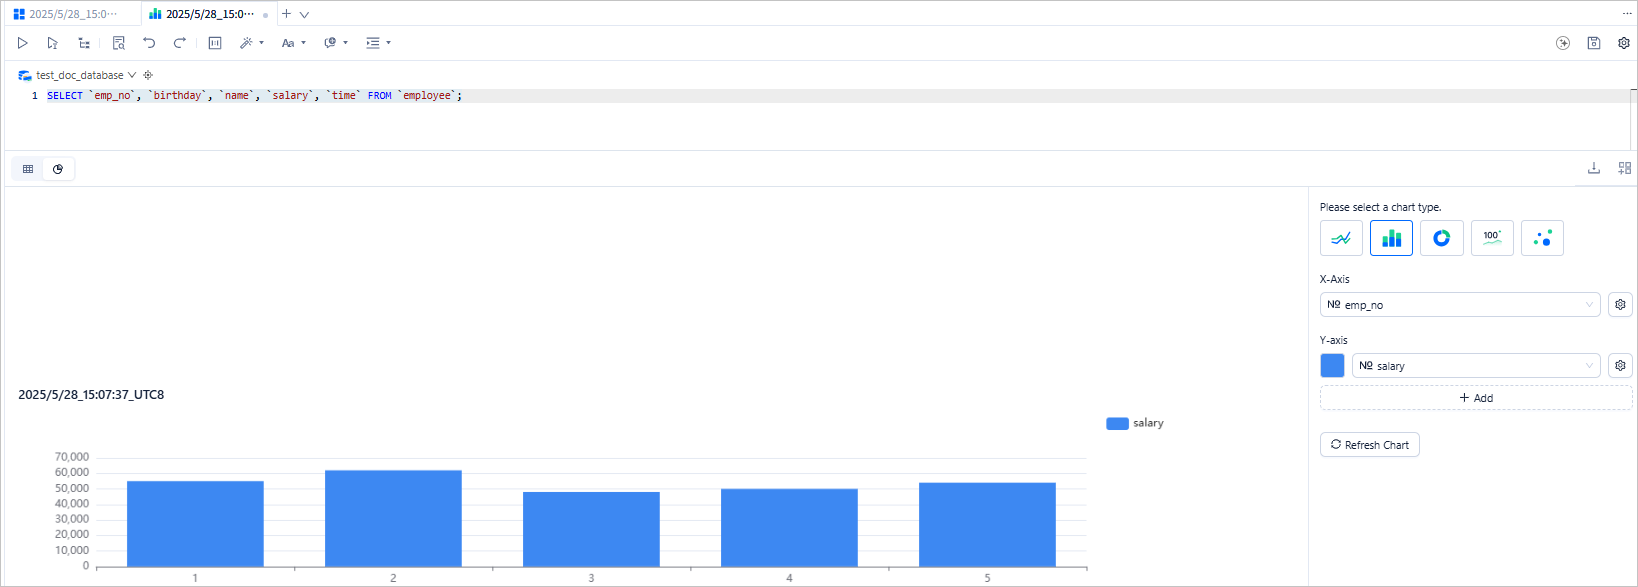
Note
You can double-click or right-click the name of a chart in the SQL window to rename the chart.
On the result tab, click the
 icon, select the bar chart, and configure the X and Y axes. Then, click Refresh Chart.
In the toolbar, click the save icon to save the chart. You can also click the
 icon on the result tab to save the configured chart to the dashboard.
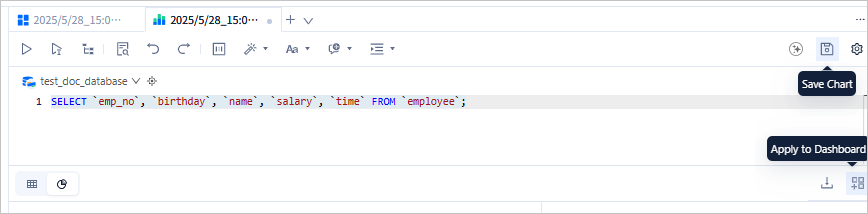
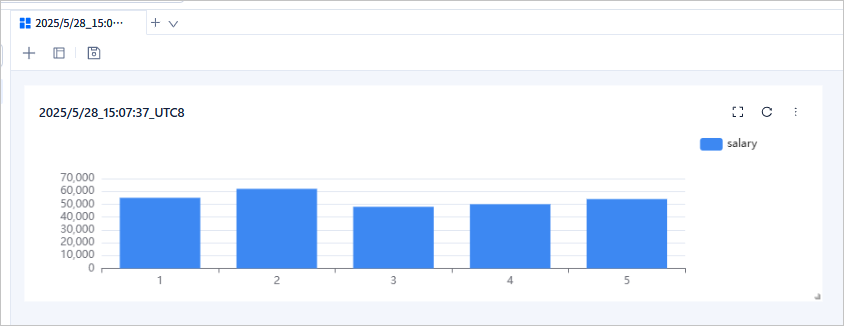
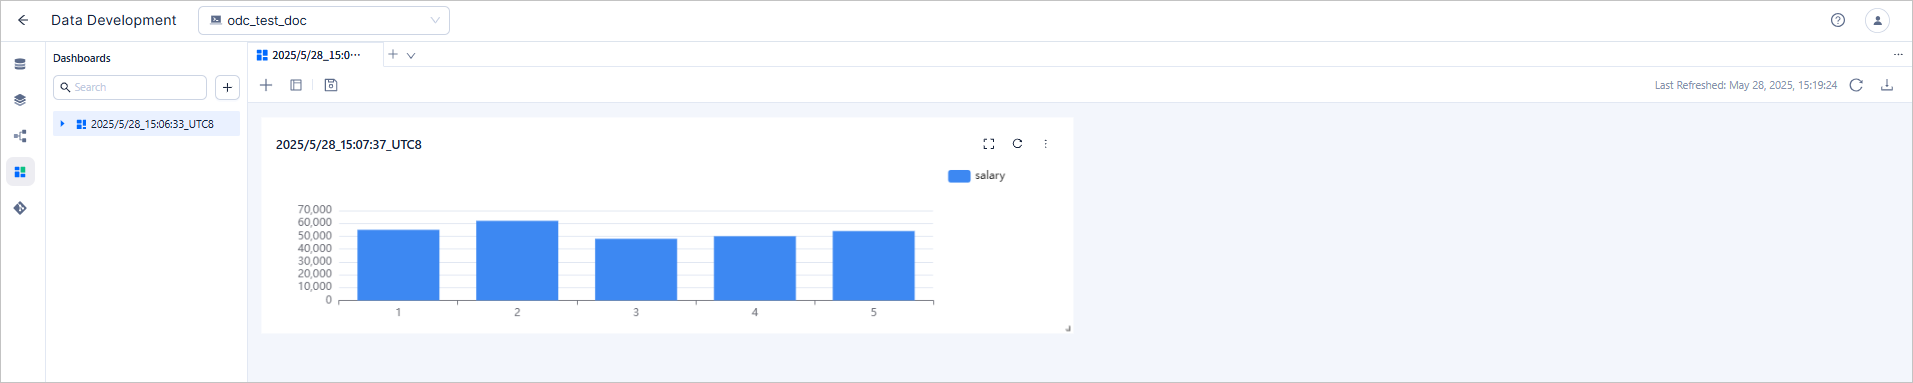
In the dashboard list, view the information about the added chart.
Manage the dashboard
Manage dashboards
Action |
Description |
|---|---|
| Search for a dashboard | Enter the name of the dashboard in the search box to search for the specified dashboard. |
| Create a dashboard | Click Create to create a dashboard. |
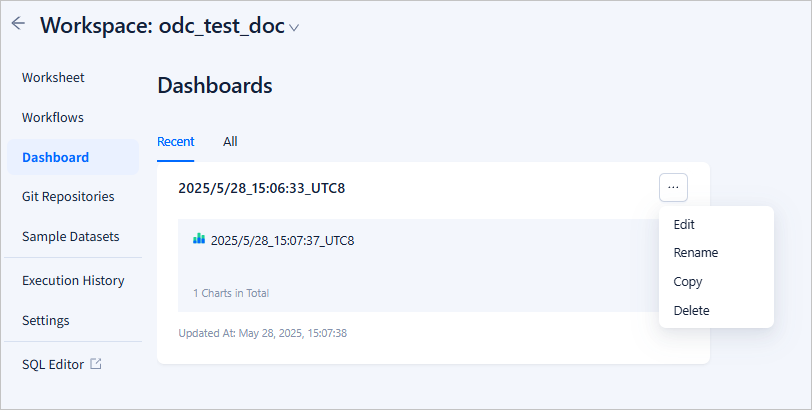
| Edit a dashboard | Click the more icon next to the name of the dashboard and select Edit. |
| Rename a dashboard | Click the more icon next to the name of the dashboard and select Rename. |
| Copy a dashboard | Click the more icon next to the name of the dashboard and select Copy. |
| Delete a dashboard | Click the more icon next to the name of the dashboard and select Delete. |
Manage charts
In the dashboard list, click the more icon next to the name of a chart, select Edit from the drop-down list, and then click the chart to go to the chart list page.
Action |
Description |
|---|---|
| Add a chart | In the toolbar of the dashboard page, click the plus sign (+) to add a chart. |
| Arrange charts | In the toolbar of the dashboard page, click the |
| Save the dashboard | In the toolbar of the dashboard page, click the |
| Refresh the chart list | In the toolbar of the dashboard page, click the |
| Download the current chart data | In the toolbar of the dashboard page, click the |
| Rename the chart | Click the more icon next to the name of a chart, and then click |
| Zoom in on the chart | In the chart list, click the |
| Refresh the current chart data | In the chart list, click the |
| Edit the chart | In the chart list, click the more icon next to the chart, select Edit from the drop-down list, and then click the chart to edit it. |
| Copy the chart | In the chart list, click the more icon next to the chart, select Copy from the drop-down list, and then click the chart to copy it. |
| Delete the chart | In the chart list, click the more icon next to the chart, select Delete from the drop-down list, and then click the chart to delete it. |
Edit a chart
In the chart list, click the more icon next to the name of the chart that you want to edit and choose Edit.

Button |
Description |
|---|---|
| Switch to the chart | On the result tab, click the |
| Download the chart | On the result tab, click the |
| Save the chart to the dashboard | On the result tab, click the |