


Slow SQL refers to SQL statements that take a long time to execute in the database, typically those that exceed a specified time threshold. The default time threshold for OceanBase Cloud is 100 ms.
Create a slow SQL alert
Log in to the OceanBase Cloud console.
In the left-side navigation pane, click Alert.
On the page that appears, click the Alert Rules tab.
On the page that appears, click Create Alert Rule.
Configure the alert rule.
Configure the rule.
ParameterDescriptionRule Name The name of the alert rule, such as oas_test. Alert Object Type The alert object. Select Tenant. Select Instance The target instance. Select Tenant The target tenant. Alert Type The alert type. Select Indicators. Configuration Method The configuration method. Select Custom. Trigger Condition The trigger condition. Select Meet All Conditions. Alert Metric - In the Alert Metric drop-down list, select Slow SQL Count.
- In the Comparison Value drop-down list, select Maximum.
- In the Operator drop-down list, select >=.
- Enter 0 in the Threshold field.
Alert Detection Cycle The alert detection cycle. For example, Continuous 1 Cycle (1 Cycle = 1 Minute). Alert Frequency The alert trigger frequency. For example, Alert Only Once. 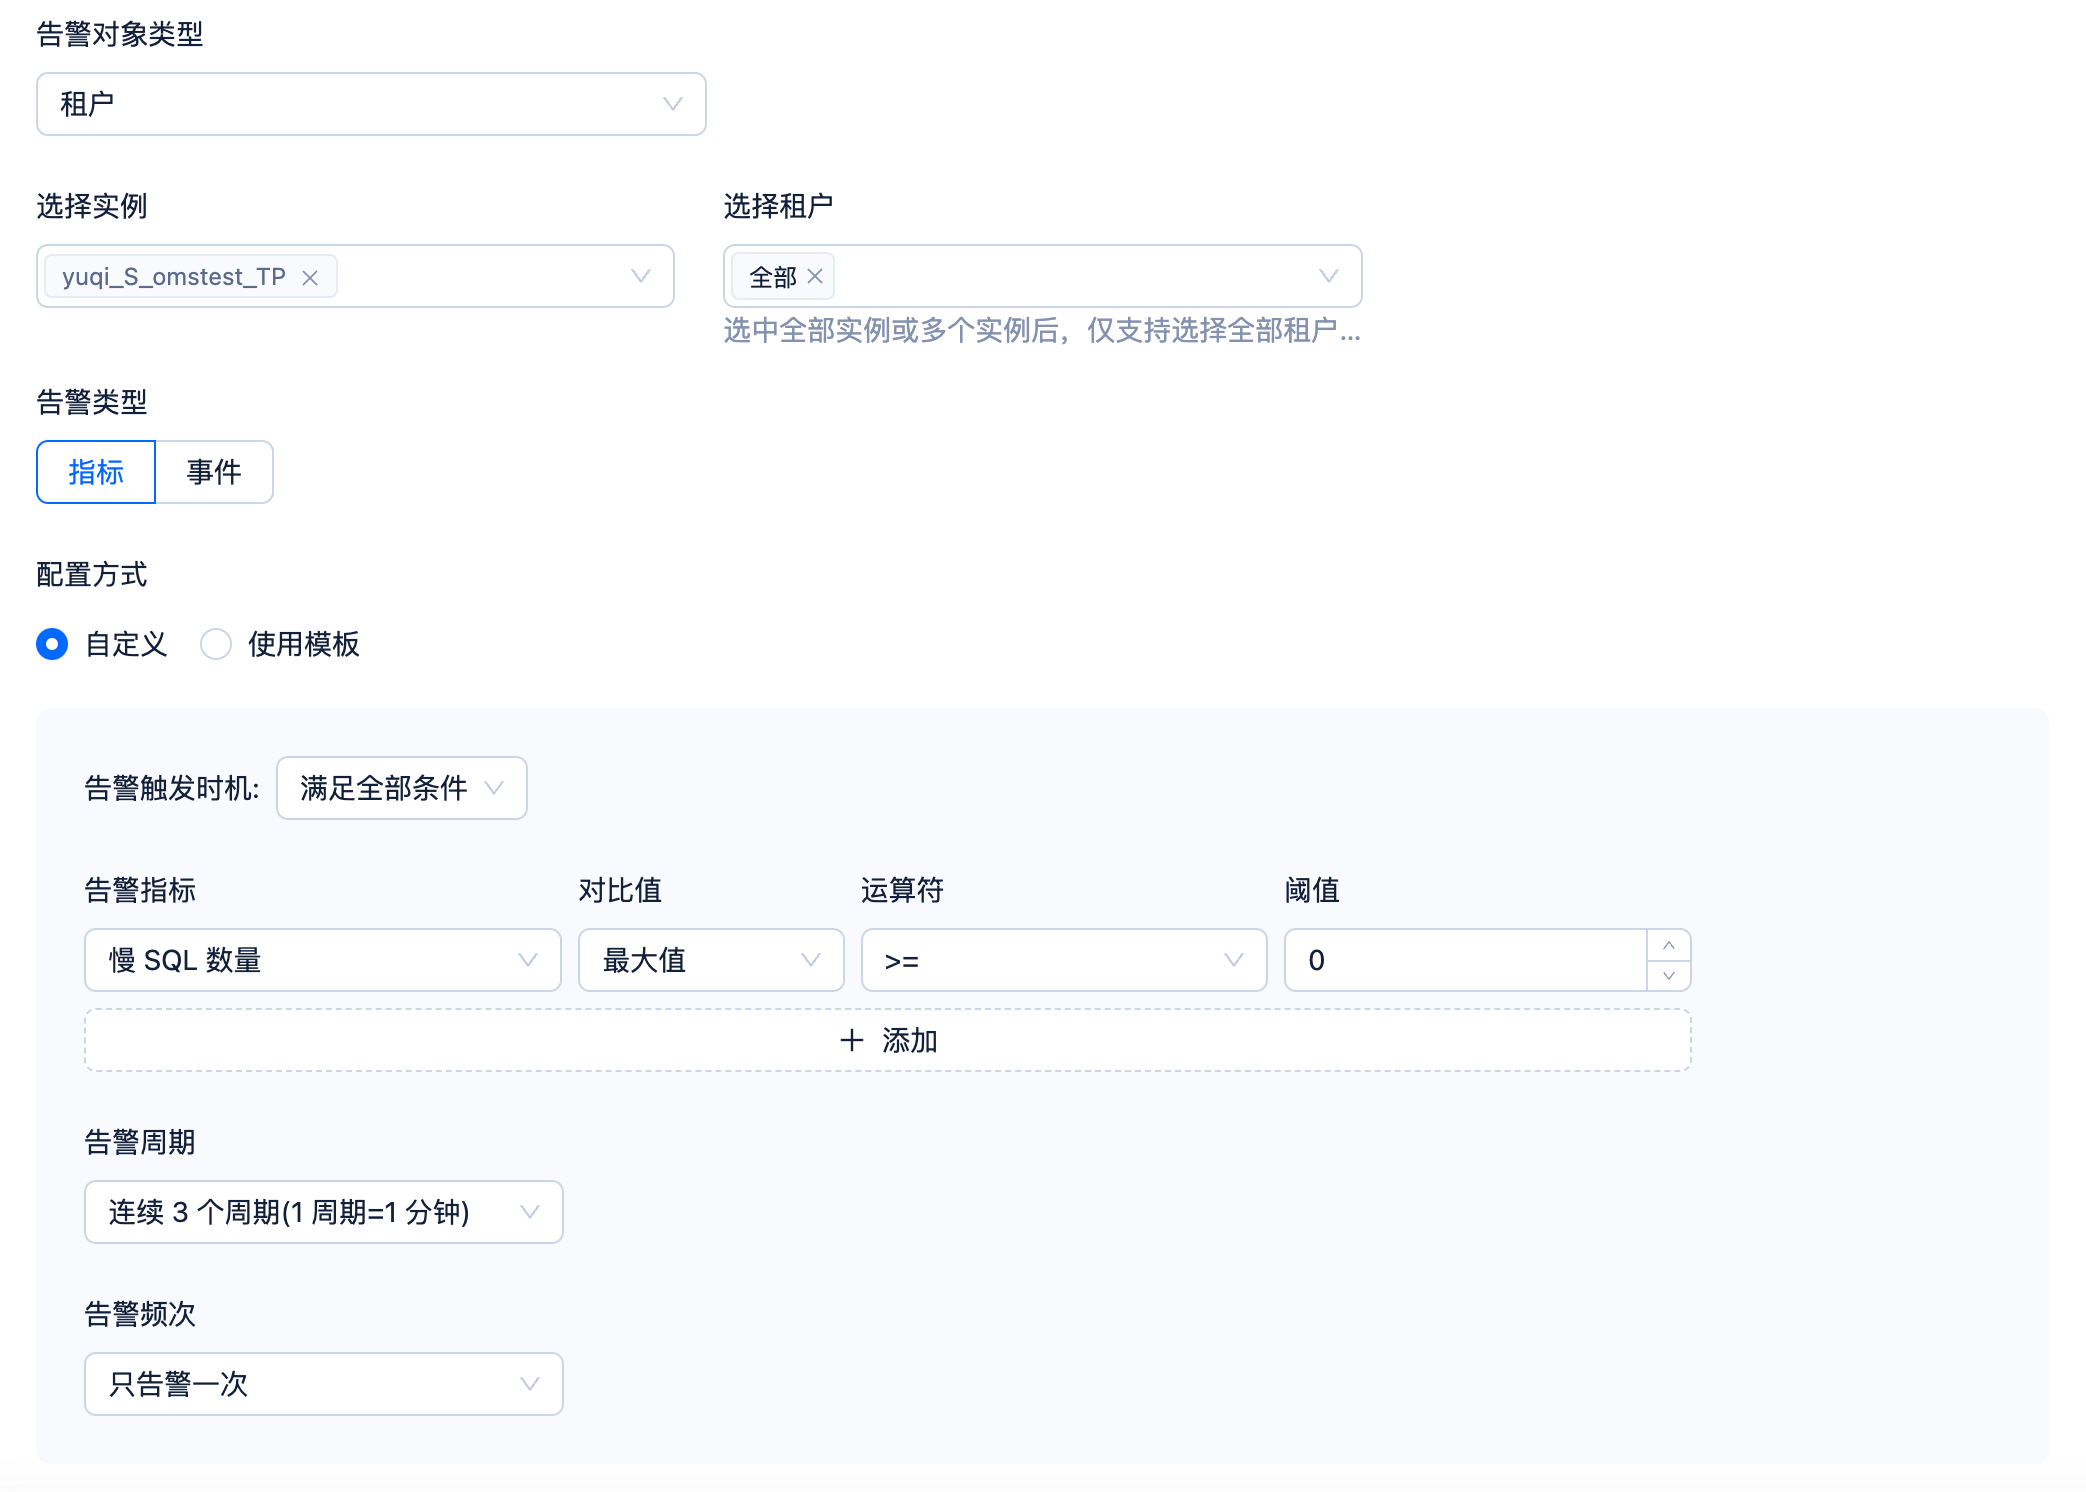
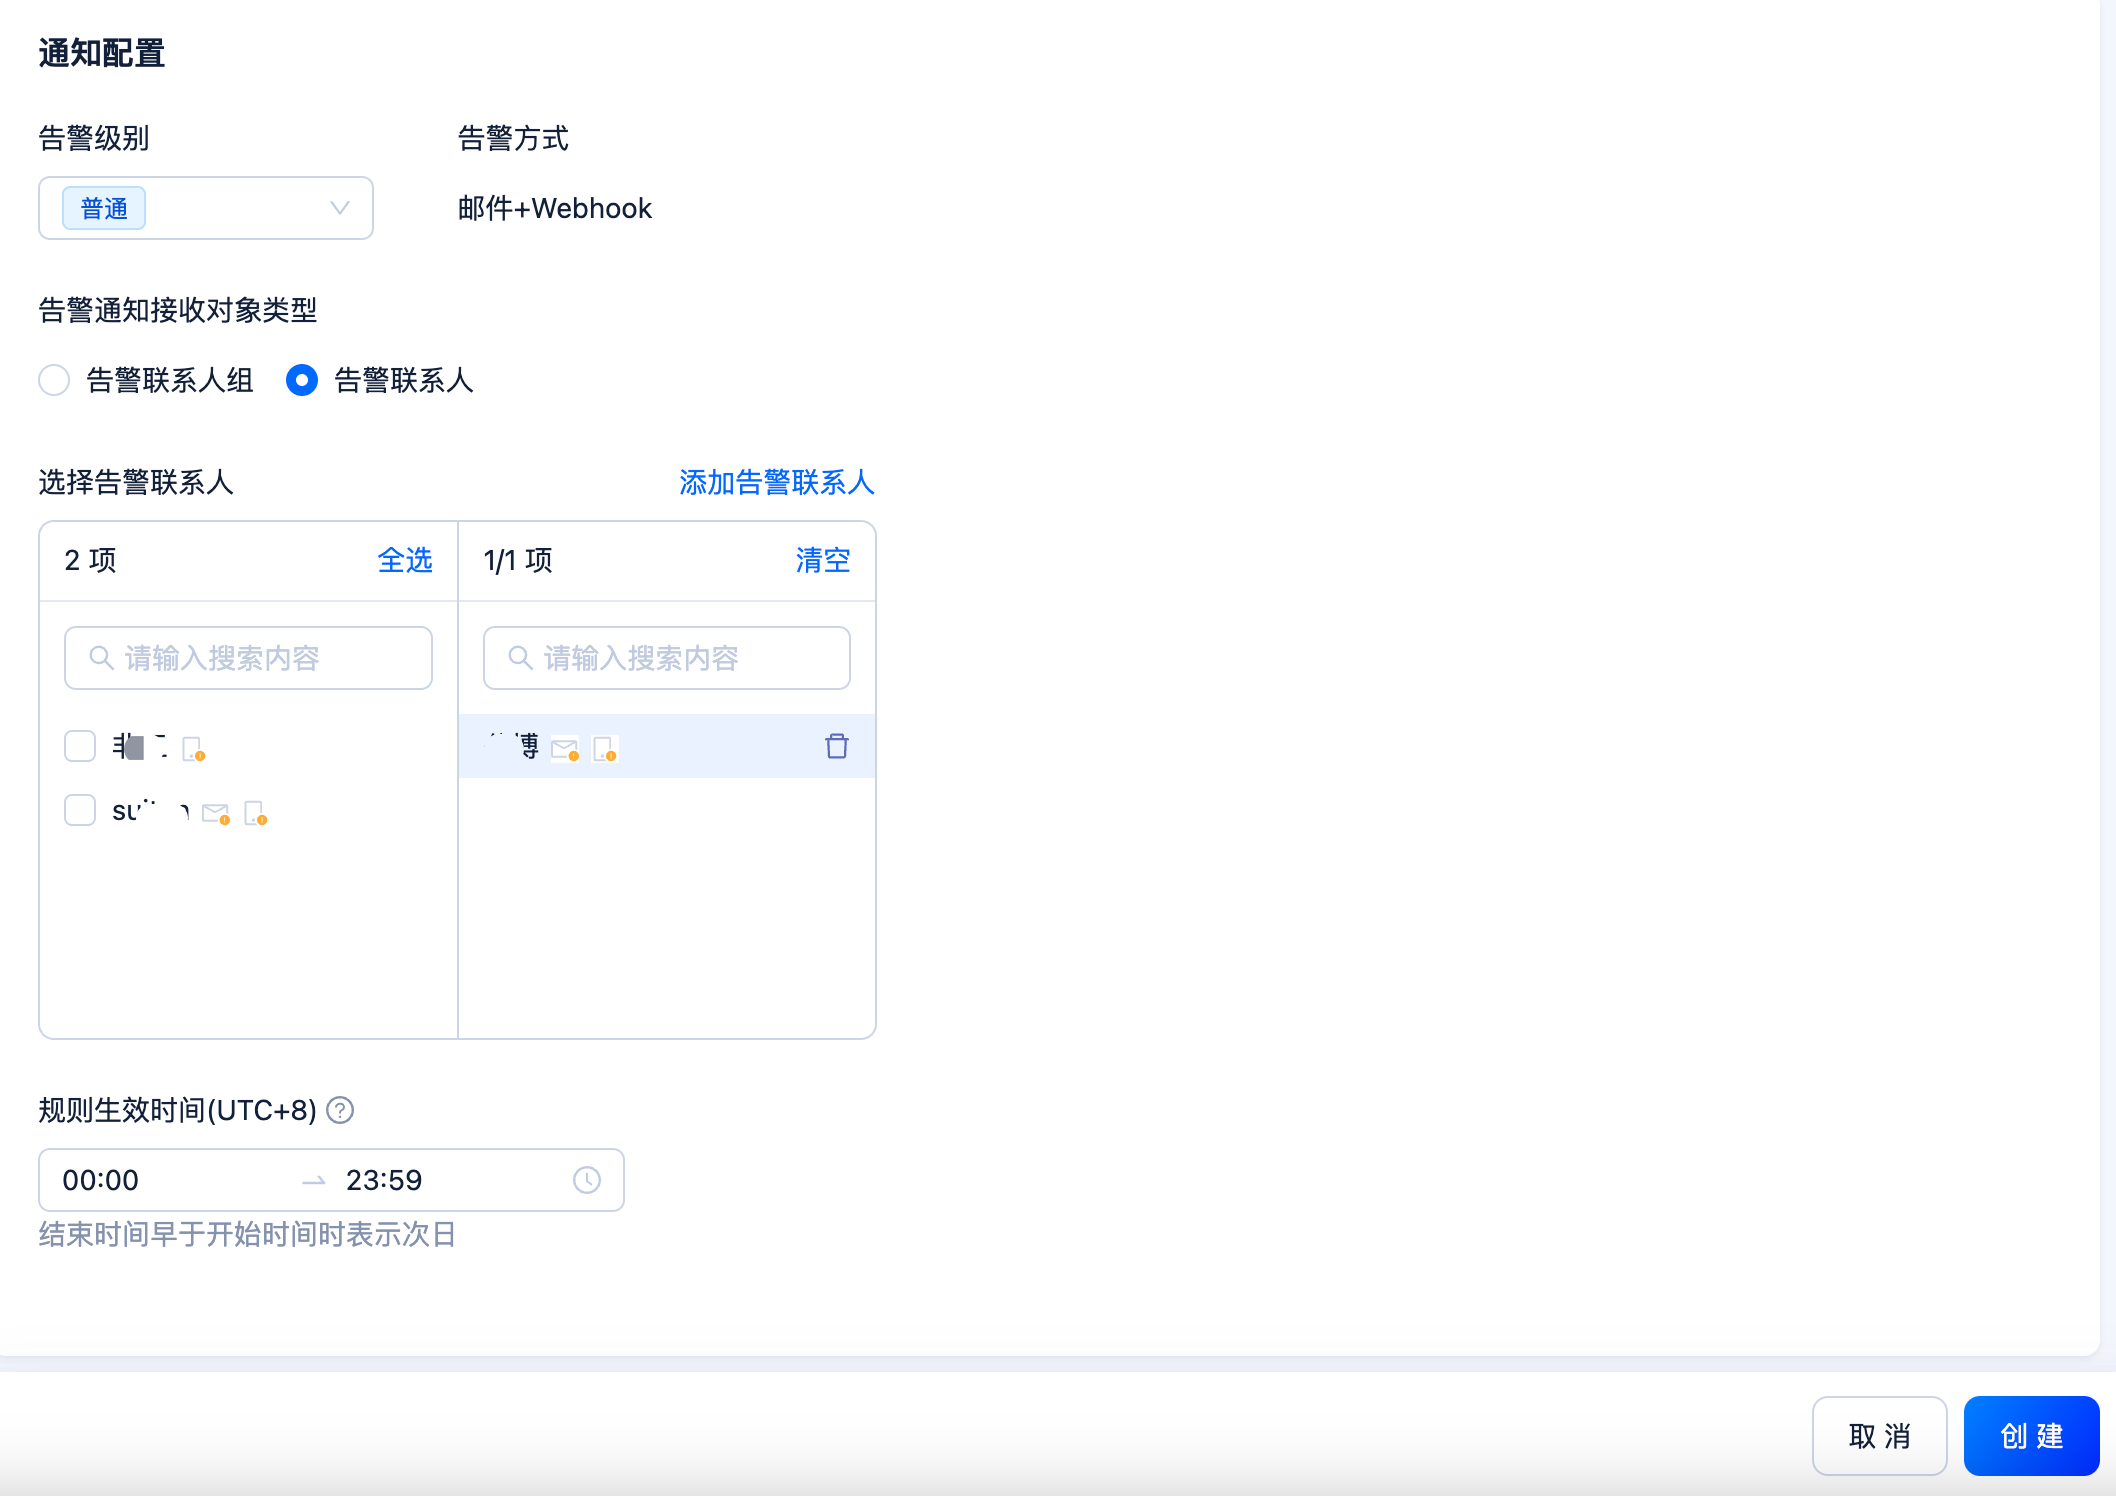
Configure the notification.
ParameterDescriptionAlert Level The alert level. You can select Info, Warning, or Critical. Alert Method The alert method. By default, it is email + webhook. Alert Recipient Type The type of the alert recipient. You can select an alert contact group or an alert contact. Effective Time of Rule The effective time of the rule.
Click Create.
Query the list of slow SQL statements
Log in to the OceanBase Cloud console.
In the left-side navigation pane, click Instances.
In the instance list, find the target instance and click its name to go to the instance overview page.
In the left-side navigation pane, click Tenants.
In the tenant management list, click the name of the target tenant to go to the tenant overview page.
In the left-side navigation pane, click Diagnostics.
On the Diagnostics page, click the SQL tab and select Slow SQL.
(Optional) Configure the filter conditions.
Database: select a database in the current tenant.
Node: select a node in the current database.
Time range: select a time range. You can also customize the time range (up to 7 days). Note the following limitations:
- Maximum range: The selected time range cannot exceed 24 hours.
- Minimum range:
- For the last 3 days: The selected time range must be at least 1 minute.
- For 3 to 7 days: The selected time range must be at least 5 minutes.
SQL ID: enter the SQL ID to be queried. You can enter multiple IDs and separate them with half-width characters , or ;.
SQL text: enter the SQL text keyword to be queried. The query results will display SQL statements containing this keyword. Constant search is not supported.
More Conditions: click +Add and, in the Add More Conditions panel, configure the metrics, operators, and metric values. During the query, the SQL statements that meet the conditions will be displayed in the query result list.
Quick Filter: supports Full Table Scan, Multi-partition scan, Multiple Remote Executions, Hard Parsing, Error Executions, and Retry execution.
- Click Query.
Filter SQL statements by Tenant Name and Database.
In the Actions column, click View samples to view the SQL sample.
- Select Aggregation In Query to aggregate the results of in queries, but this does not affect the statistics. In the list, you can see the Aggregated identifier. Hover the pointer over the corresponding SQL ID to view other SQL IDs that are aggregated.
Note
For SQL statements that contain the IN clause and whose content consists of different numbers of simple constants, if the Aggregate In Query feature is not enabled, the real-time diagnosis feature treats them as different types of SQL statements. If the Aggregate In Query feature is enabled, the real-time diagnosis feature treats them as the same type of SQL statements and aggregates their statistics into one row.
Select ... > Download Table to download the list of slow SQL statements.
Select ... > Modify Slow SQL Threshold. In the dialog box that appears, modify the slow SQL threshold and click OK.
Click the
 icon to query more metrics in the Manage Columns window.