


With the request analysis feature, you can diagnose the SQL health status of databases under a specified tenant within a selected time range.
Procedure
Log in to the OceanBase Cloud console.
In the left-side navigation pane, click Instances.
In the instance list, find the target instance, click the instance name, and go to the Overview page of the instance.
In the left-side navigation pane, click Diagnostics. On the Diagnostics page, click the Real-Time Diagnostics tab.
At the bottom of the page, click the tab Request Analysis.
(Optional) Configure filter conditions.
Time: You can view data for the following time periods: Past 5 Minutes, Past 30 Minutes, Past 1 Hour, and Past 6 Hour(s). You can also customize the time period, with a maximum of 7 days. However, note the following limitations:
- Maximum range limit: The selected time period must not exceed 24 hours.
- Minimum range limit:
- For data within 3 days: The selected time period must be at least 1 minute.
- For data from 3 to 7 days: The selected time period must be at least 5 minutes.
Database: Select any database under the current cluster.
SQL Type: Select the SQL type to be queried. You can select multiple types.
Click Query.
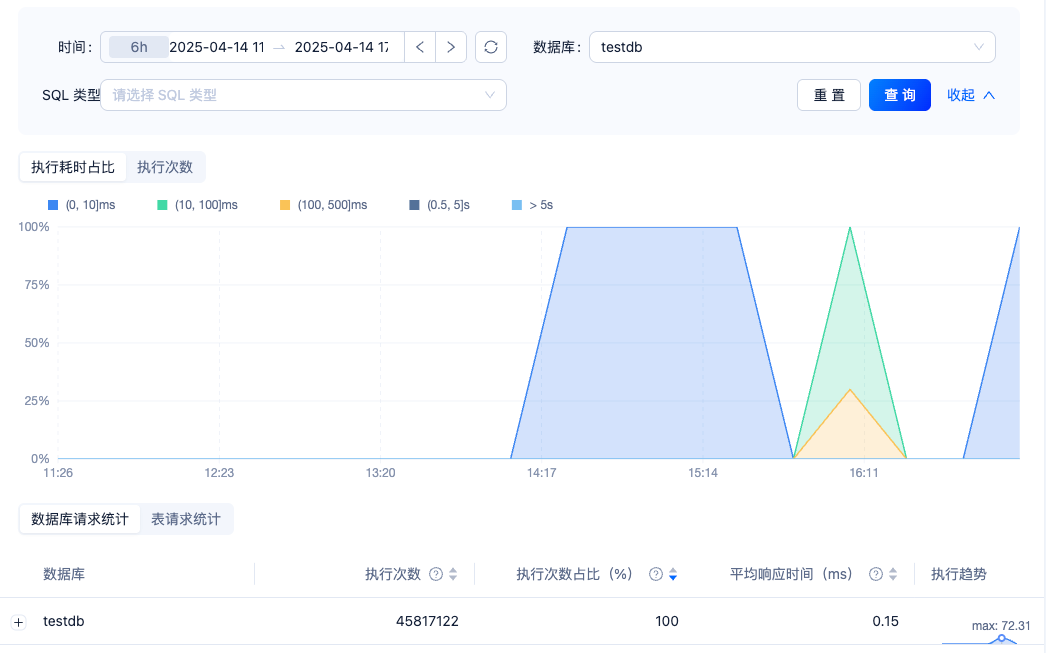
As shown in the preceding figure:
Execution Time Percentage: Shows the distribution of execution times for all SQL statements in the selected time period. The system divides the execution times into five intervals as follows:
(0, 10]ms indicates the percentage of SQL statements with execution times greater than 0 ms and less than or equal to 10 ms. The value is displayed in blue.
(10, 100]ms indicates the percentage of SQL statements with execution times greater than 10 ms and less than or equal to 100 ms. The value is displayed in green.
(100, 500]ms indicates the percentage of SQL statements with execution times greater than 100 ms and less than or equal to 500 ms. The value is displayed in orange.
(0.5, 5]s indicates the percentage of SQL statements with execution times greater than 0.5 s and less than or equal to 5 s. The value is displayed in gray.
-
5s indicates the percentage of SQL statements with execution times greater than 5 s. The value is displayed in light blue.
Note
If a database has a higher execution time percentage in the blue interval, its SQL health is better. If the database has a higher execution time percentage in the gray or light blue interval, its SQL health is worse.
Number of executions: Shows the execution count of SQL statements in the selected time period.
Database Request Statistics: Shows the execution count, percentage of execution count (%), average response time (ms), and execution trend of the database in the selected time period.
Table Request Statistics: Shows the execution count, percentage of execution count (%), average response time (ms), and execution trend of tables in the selected time period.