


Session management allows you to view tenant sessions, perform session statistics, and detect deadlocks.
Background information
The connection between an application and a database is called a session. On the Session Management tab, you can view the Number of All Sessions, Active Sessions, and Number of Idle Sessions.
Tenant sessions
Note
- An agent session is recorded on the database proxy server.
- A database session is recorded on an OceanBase server and identifies a unique database connection on the server.
- The Tenant Sessions tab displays only the sessions at the current time. One agent session corresponds to multiple database sessions, but only one database session is displayed. If there are active database sessions, they are displayed. Otherwise, a database session is displayed randomly.
Procedure
Log in to the OceanBase Cloud console.
In the left-side navigation pane, click Instances.
In the instance list, find the target instance, click the instance name, and go to the Overview page of the instance.
Click Diagnostics in the left-side navigation pane, and then select the Session Management tab on the Diagnostics page.
On the Session Management tab, click Tenant Session. You can search for sessions by proxy session ID, database session ID, SQL ID, or SQL statement.
Select View Only Active Sessions to view the information about active sessions in the session list. You can select multiple active sessions to set throttling limits in bulk.

Select Aggregate Sessions by SQL ID to summarize sessions with the same SQL ID.
Note
Aggregating sessions by SQL ID helps you analyze the traffic and consumption of different SQL IDs to identify the resource consumers.
Select Show Sessions by Aggregation in SQL to display sessions aggregated by IN SQL statements, without affecting the statistics. You can select multiple active sessions to set throttling limits in bulk.
Note
Aggregation by IN SQL means ignoring the number of constant parameters in the IN clause of SQL statements. Each IN clause is treated as having only one constant parameter. The system then parameterizes the SQL statements and calculates the SQL ID based on this rule. SQL statements with the same SQL ID are classified into the same category and aggregated.
The tenant session information is as follows:
ParameterDescriptionProxy Session ID The session ID recorded by the database proxy server. Database Session ID The session ID recorded by the OceanBase server, which identifies a unique database connection on the OceanBase server. SQL ID The ID of the SQL statement being executed in the session, which is the unique identifier of the SQL statement. SQL Text The content of the SQL statement being executed in the session. User The database username used to log in to the session. Source The address from which the session is initiated. It is usually the client IP address. Destination The address to which the session is sent. Database Node The database node that the session accesses. Database The database that the session accesses. Command The type of command being executed in the session. Execution Time (s) The time consumed by the SQL statement being executed in the session. You can sort sessions by Execution Time (s). CPU Time (s) The CPU time occupied by the SQL statement being executed in the session. You can sort sessions by CPU Time (s). Status The current status of the session, which can be CLOSED (closed) or ACTIVE (active). You can click Close Session in the operation column of a session to delete the session. You can select multiple sessions and then click Close sessions in batches to close the selected sessions.
Note
After a session is closed, you can click View Optimization Records > Optimization History in the upper-right corner of the **Sessions** tab to view the task status.
Session statistics
On the Session Statistics tab, you can view or export the number of active sessions and the total number of sessions in the current cluster from the user, access source, and database dimensions.
Click 10s SQL Analysis in the upper-right corner to statistics SQL execution in the tenant in 10 seconds. You can view the statistics based on SQL type, User, Source, and Database.
Deadlock detection
OceanBase Database uses multi-version two-phase locking to maintain the correctness of its concurrency control model. The locking mechanism is crucial for ensuring data concurrency and consistency.
However, the locking mechanism can also lead to deadlocks, which occur when there is a cyclic dependency on resources. For example, if transaction A and transaction B both attempt to acquire resources 1 and 2, transaction A might first acquire resource 1 and then try to acquire resource 2, while transaction B might first acquire resource 2 and then try to acquire resource 1. In such a case, unless a transaction is willing to release the resource it has acquired, no transaction can complete.
Note
Deadlock detection is supported in OceanBase Database V3.2 and later.
Procedure
Note
After deadlock detection is enabled, OceanBase Database will detect and handle deadlock events in real time in this cluster. This consumes about 2% of the performance. Decide whether to enable it based on your actual situation.
For the first time you use deadlock detection, click Enable Automatic Deadlock Detection.
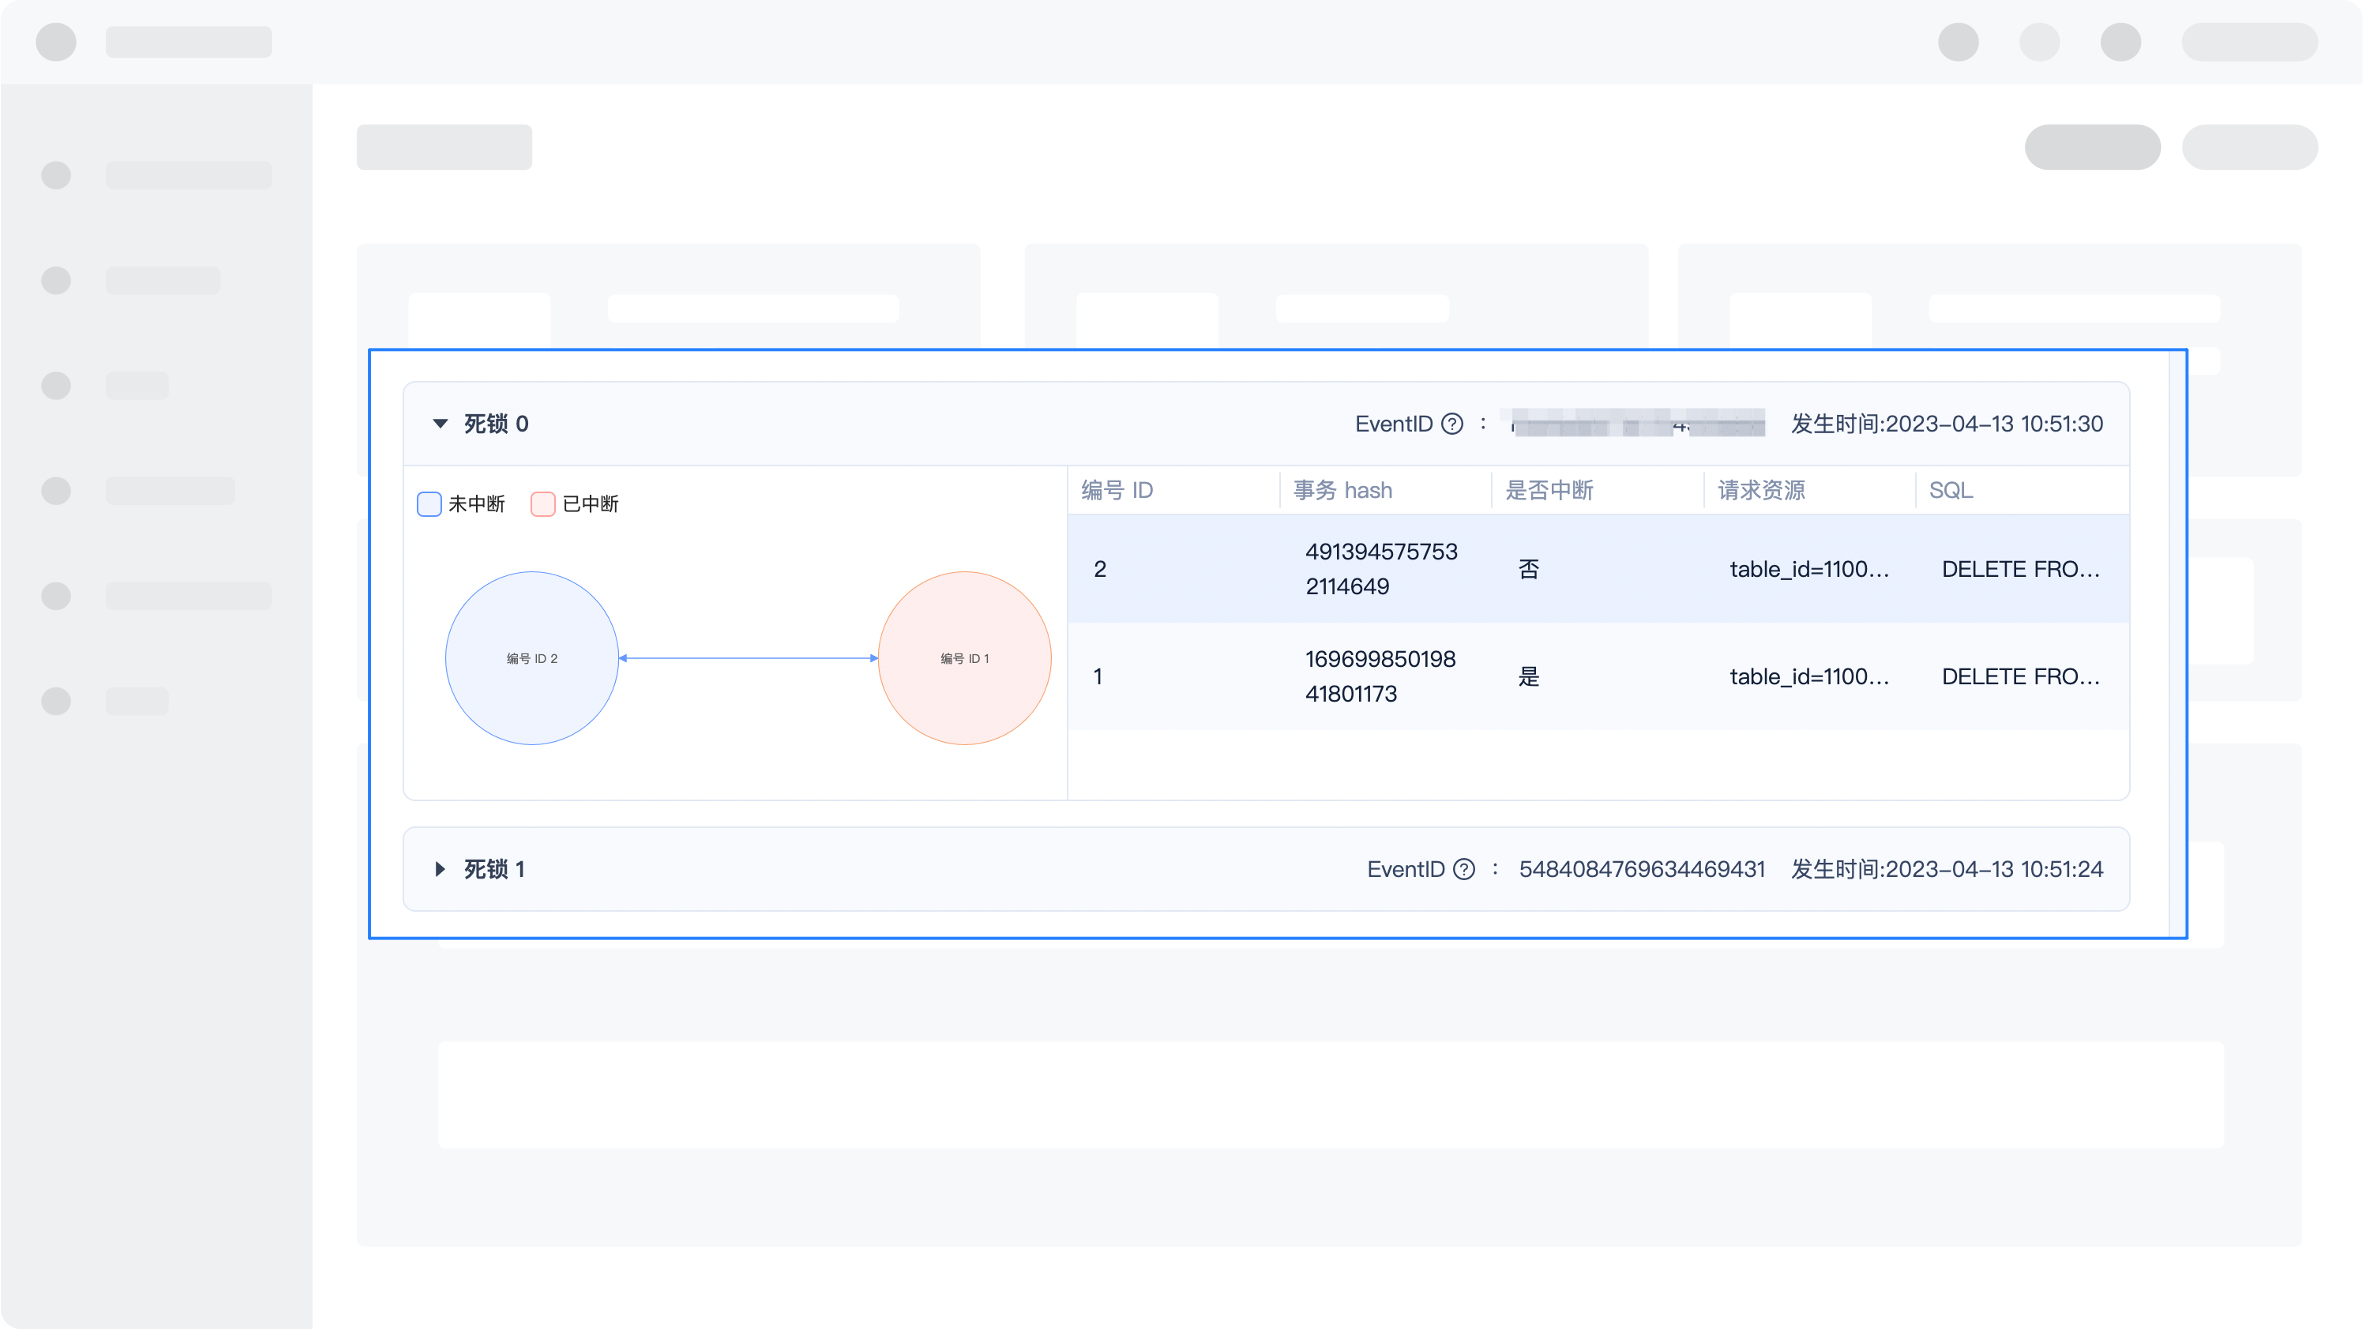
After deadlock detection is enabled, the system starts to detect whether there are deadlocks in the tenants of this cluster and displays the detection results on the Deadlock Details page, keeping results for the last 7 days.
You can click Disable Automatic Deadlock Detection in the upper-right corner or refresh the page to disable or refresh the deadlock detection details.