


With the request analysis feature, you can diagnose the SQL health status of databases under a tenant within a selected time range.
Procedure
Log in to the OceanBase Cloud console.
In the left-side navigation pane, click Instances.
In the instance list, find the target instance, click the instance name, and go to the Overview page of the instance.
Click Diagnostics in the left-side navigation pane, and then select the Real-Time Diagnostics tab on the Diagnostics page.
Click the Request Analysis tab at the bottom of the page.
(Optional) Set filter conditions.
Time: You can view data for the following time ranges: Past 5 Minutes, Past 30 Minutes, Past 1 Hour, and Past 6 Hour(s). You can also customize the time range, with a maximum of 7 days. However, note the following limitations:
- Maximum range limit: The selected time range must not exceed 24 hours.
- Minimum range limit:
- For data within 3 days: The selected time range must be at least 1 minute.
- For data from 3 to 7 days: The selected time range must be at least 5 minutes.
Database: Select any database in the current cluster.
SQL Type: Select the type of SQL to query. You can choose multiple types.
Click Query.
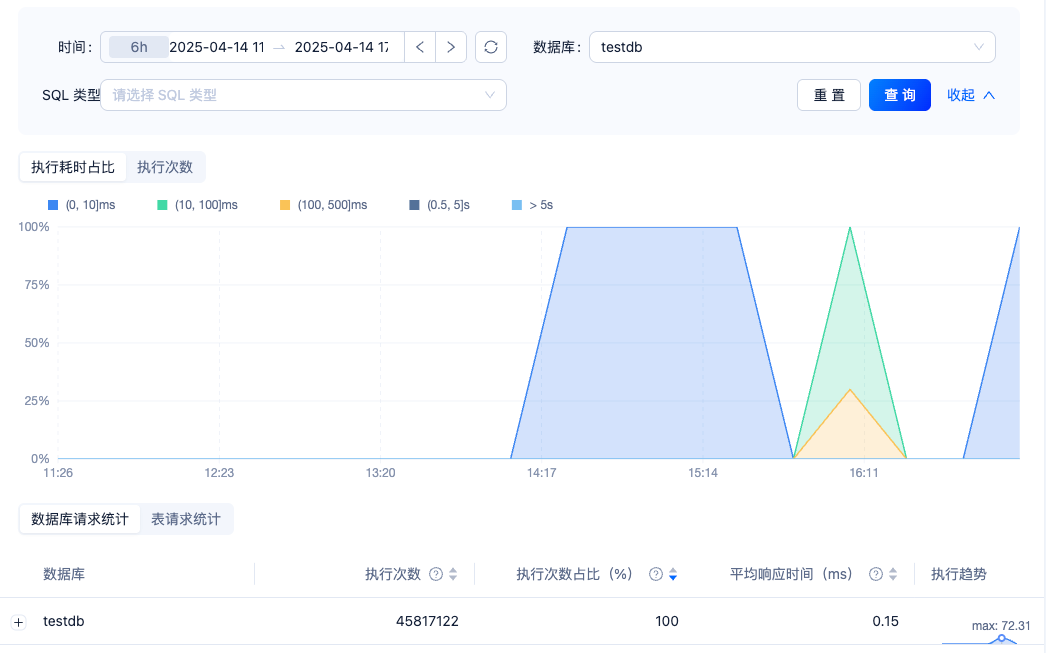
As shown in the preceding figure:
Execution Time Percentage: Shows the distribution of execution times for all SQL statements in the selected time range. The system divides the execution times into five ranges:
(0, 10]ms: The proportion of SQL statements with execution times of more than 0 ms and up to 10 ms. This range is displayed in blue.
(10, 100]ms: The proportion of SQL statements with execution times of more than 10 ms and up to 100 ms. This range is displayed in green.
(100, 500]ms: The proportion of SQL statements with execution times of more than 100 ms and up to 500 ms. This range is displayed in orange.
(0.5, 5]s: The proportion of SQL statements with execution times of more than 0.5 s and up to 5 s. This range is displayed in gray.
-
5s: The proportion of SQL statements with execution times greater than 5 s. This range is displayed in light blue.
Note
The health status of SQL statements in a database is better if its execution time is mostly within the blue range, and worse if it is mostly within the gray or light blue range.
Number of executions: Shows the execution count of SQL statements in the selected time range.
Database Request Statistics: Shows the execution count, percentage of execution count (%), average response time (ms), and execution trend of the database in the selected time range.
Table Request Statistics: Shows the execution count, percentage of execution count (%), average response time (ms), and execution trend of each table in the selected time range.