Top SQL statements are those that are frequently executed and consume a large amount of system resources, and therefore significantly impact database performance. OceanBase Cloud displays the SQL statements with the top 2,000 total execution time.
View the Top SQL list
Log in to the OceanBase Cloud console.
In the left-side navigation pane, click Instances.
In the instance list, find the target instance, click the instance name, and go to the Overview page of the instance.
Click Diagnostics in the left-side navigation pane, and then select the Real-Time Diagnostics tab on the Diagnostics page. The system displays the Top SQL sub-tab on the SQL tab by default.
(Optional) Configure filter conditions.
Database: Select any database in the current cluster.
Node: Select any node in the current database.
Time Range: View the data of the Last 5 Minutes, Last 30 Minutes, Last 1 Hour, Last 3 Hours, or Last 6 Hours. You can also customize the time range (up to 7 days), but please note the following limitations:
- Maximum Range Limit: The selected time range must not exceed 24 hours.
- Minimum Range Limit:
- For data within 3 days: The selected time range must be at least 1 minute.
- For data from 3 to 7 days: The selected time range must be at least 5 minutes.
SQL ID: Enter the SQL ID to be queried. You can enter multiple IDs and separate them with half-width characters , or ;.
SQL text: Enter the SQL text keyword to be queried. The query results will display the SQL containing the keyword in the SQL text. Constant search is not supported.
More Conditions: Click +Add, and in the Add More Conditions panel, configure the metric, operator, and value. The SQL that meets the metric conditions will be displayed in the query result list when you perform a query.
Quick Filter: Supports filtering by Full Table Scan, Multi-partition scan, Multiple Remote Executions, Hard Parsing, Error Executions, and Retry execution.
Click Query.
The Top SQL tab displays the following metrics by default: SQL text, SQL ID, Database, Total Executions, CPU (%), Total Database Time (ms), Average Time (ms), Total Errors, Maximum Response Time (ms), CPU Time (ms), Plan Generation Time (ms), and Actions.
Click + before the SQL text to view Last error and Summary of errors reported during statistical periods.
Use Database to filter the SQL text.
Use Total Executions, CPU (%), Total Database Time (ms), Average Time (ms), Total Errors, Maximum Response Time (ms), CPU Time (ms), and Plan Generation Time (ms) to sort the SQL text.
In the Actions column of an SQL statement, click View samples to view SQL samples.

In the Actions column of an SQL statement, click the ... button, and then select Set Throttling to set throttling limits for the SQL statement. You can select multiple SQL statements to set throttling limits in batches.
Click Aggregation In Query in the upper-right corner of the list to display SQL statements in aggregated in queries, without affecting the statistics. You can set throttling limits for multiple SQL statements in batches, including those in aggregated in queries.
Note
Aggregated in query means that the SQL ID is calculated based on the number of constant parameters in the in clause, regardless of the actual number of constant parameters in the in clause. The SQL statements are parameterized based on the calculated SQL ID, and SQL statements with the same SQL ID are aggregated.
Click ..., and then click Download Table to download the Top SQL list.
Click the icon
 to query more metrics in the Manage Columns window that pops up.
Compare Top SQL
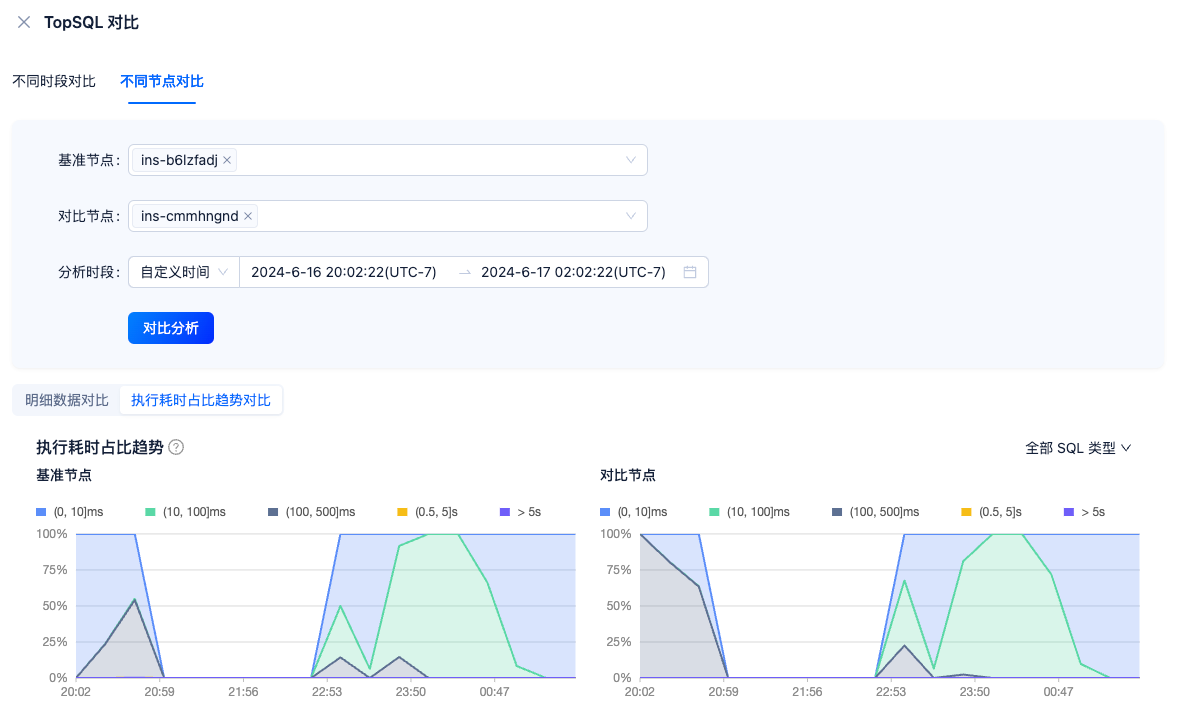
On the Top SQL tab, click Top SQL Comparison in the upper-right corner to compare the status and performance of the same SQL statement in different periods or on different nodes.
Comparison of Different Periods: Compare the running status of the same SQL on the same node in the baseline period and the comparison period. Both the baseline period and the comparison period can be customized. Select the analysis node to be compared and click Comparative Analysis to view the Comparison of Details and Comparison of Response Time Trends.
Comparison of Different Nodes: Compare the running status of an SQL statement on the baseline node with that of the same SQL statement on other nodes. You can select multiple comparison nodes. If you select multiple nodes, the system will take the average data of the intersection of the SQL running on these nodes and compare it with the same SQL on the baseline node for analysis. After you specify an analysis period, click Comparative Analysis to view the Comparison of Details and Comparison of the trend of execution time proportion.
Comparison of different nodes: Compares the execution of the same SQL statement on different nodes with the SQL statement on the baseline node as the reference. You can select multiple nodes for comparison. If multiple nodes are selected, the system compares the average data of the SQL statements executed on these nodes with the SQL statements executed on the baseline node. After you select or customize an analysis period, click Comparative Analysis to view the Comparison of Details and Comparison of the trend of execution time proportion of the SQL statements during the analysis period on different nodes.
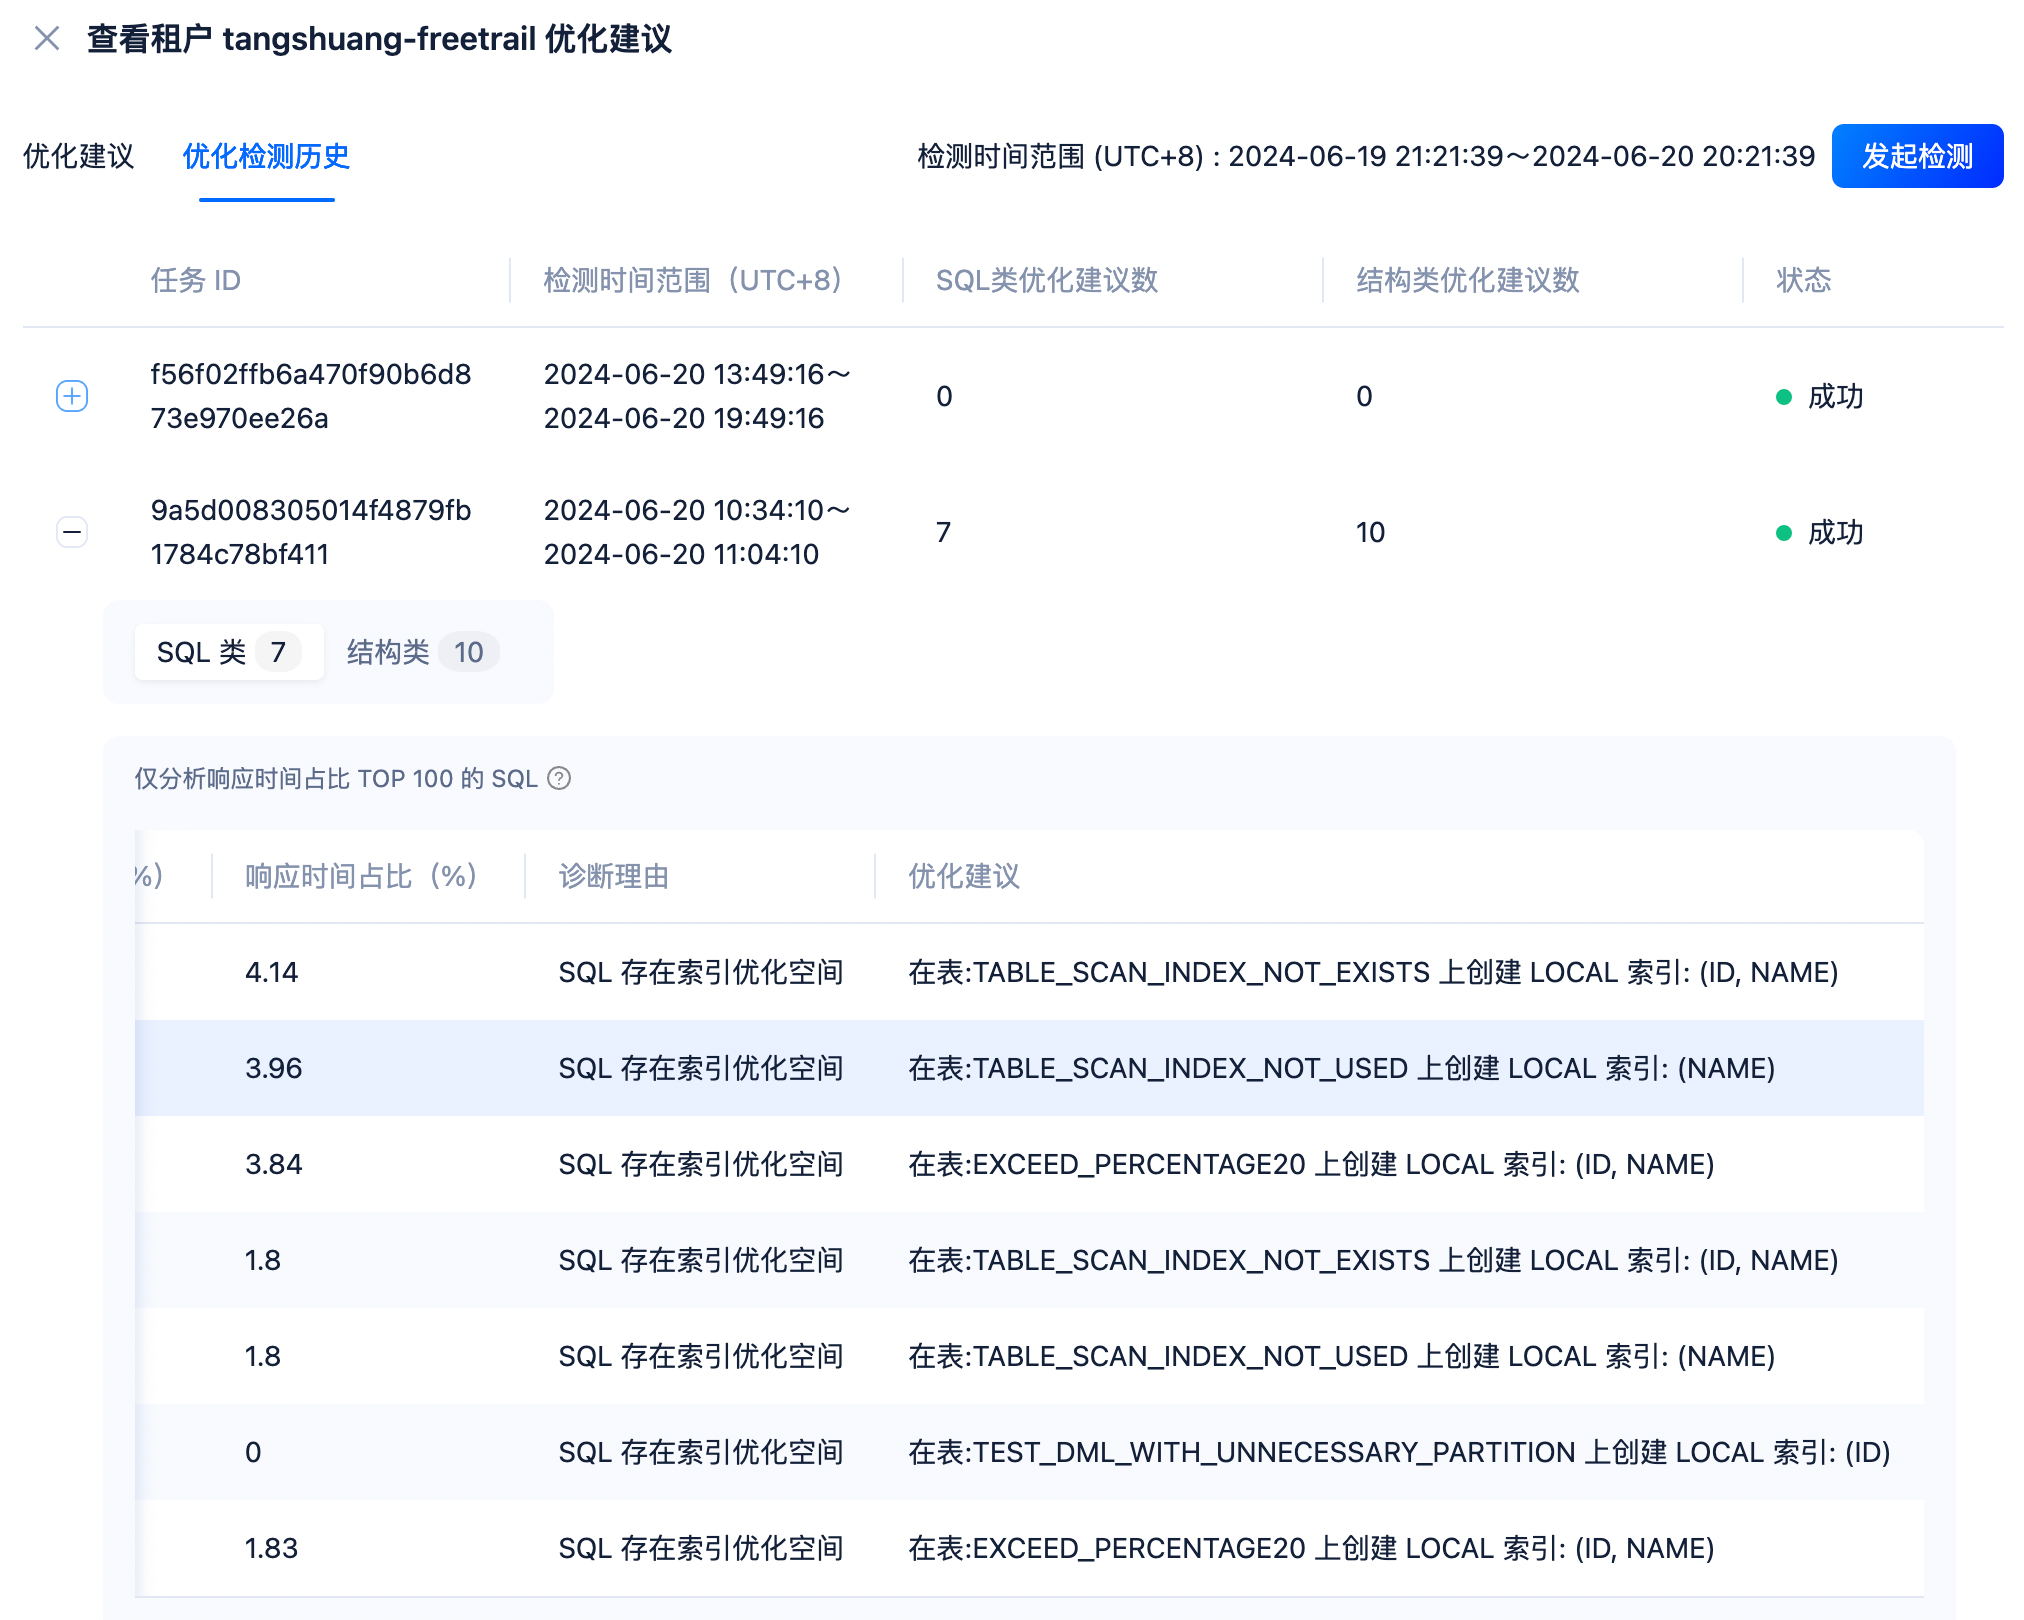
View optimization suggestions and detection history
On the Top SQL tab, click View Optimization Recommendation in the upper-right corner of the list. In the panel that appears, view the QPS, Average SQL statement processing time, CPU Usage, and other metrics for the specified tenant, as well as the optimization suggestions for SQL and schema classes.
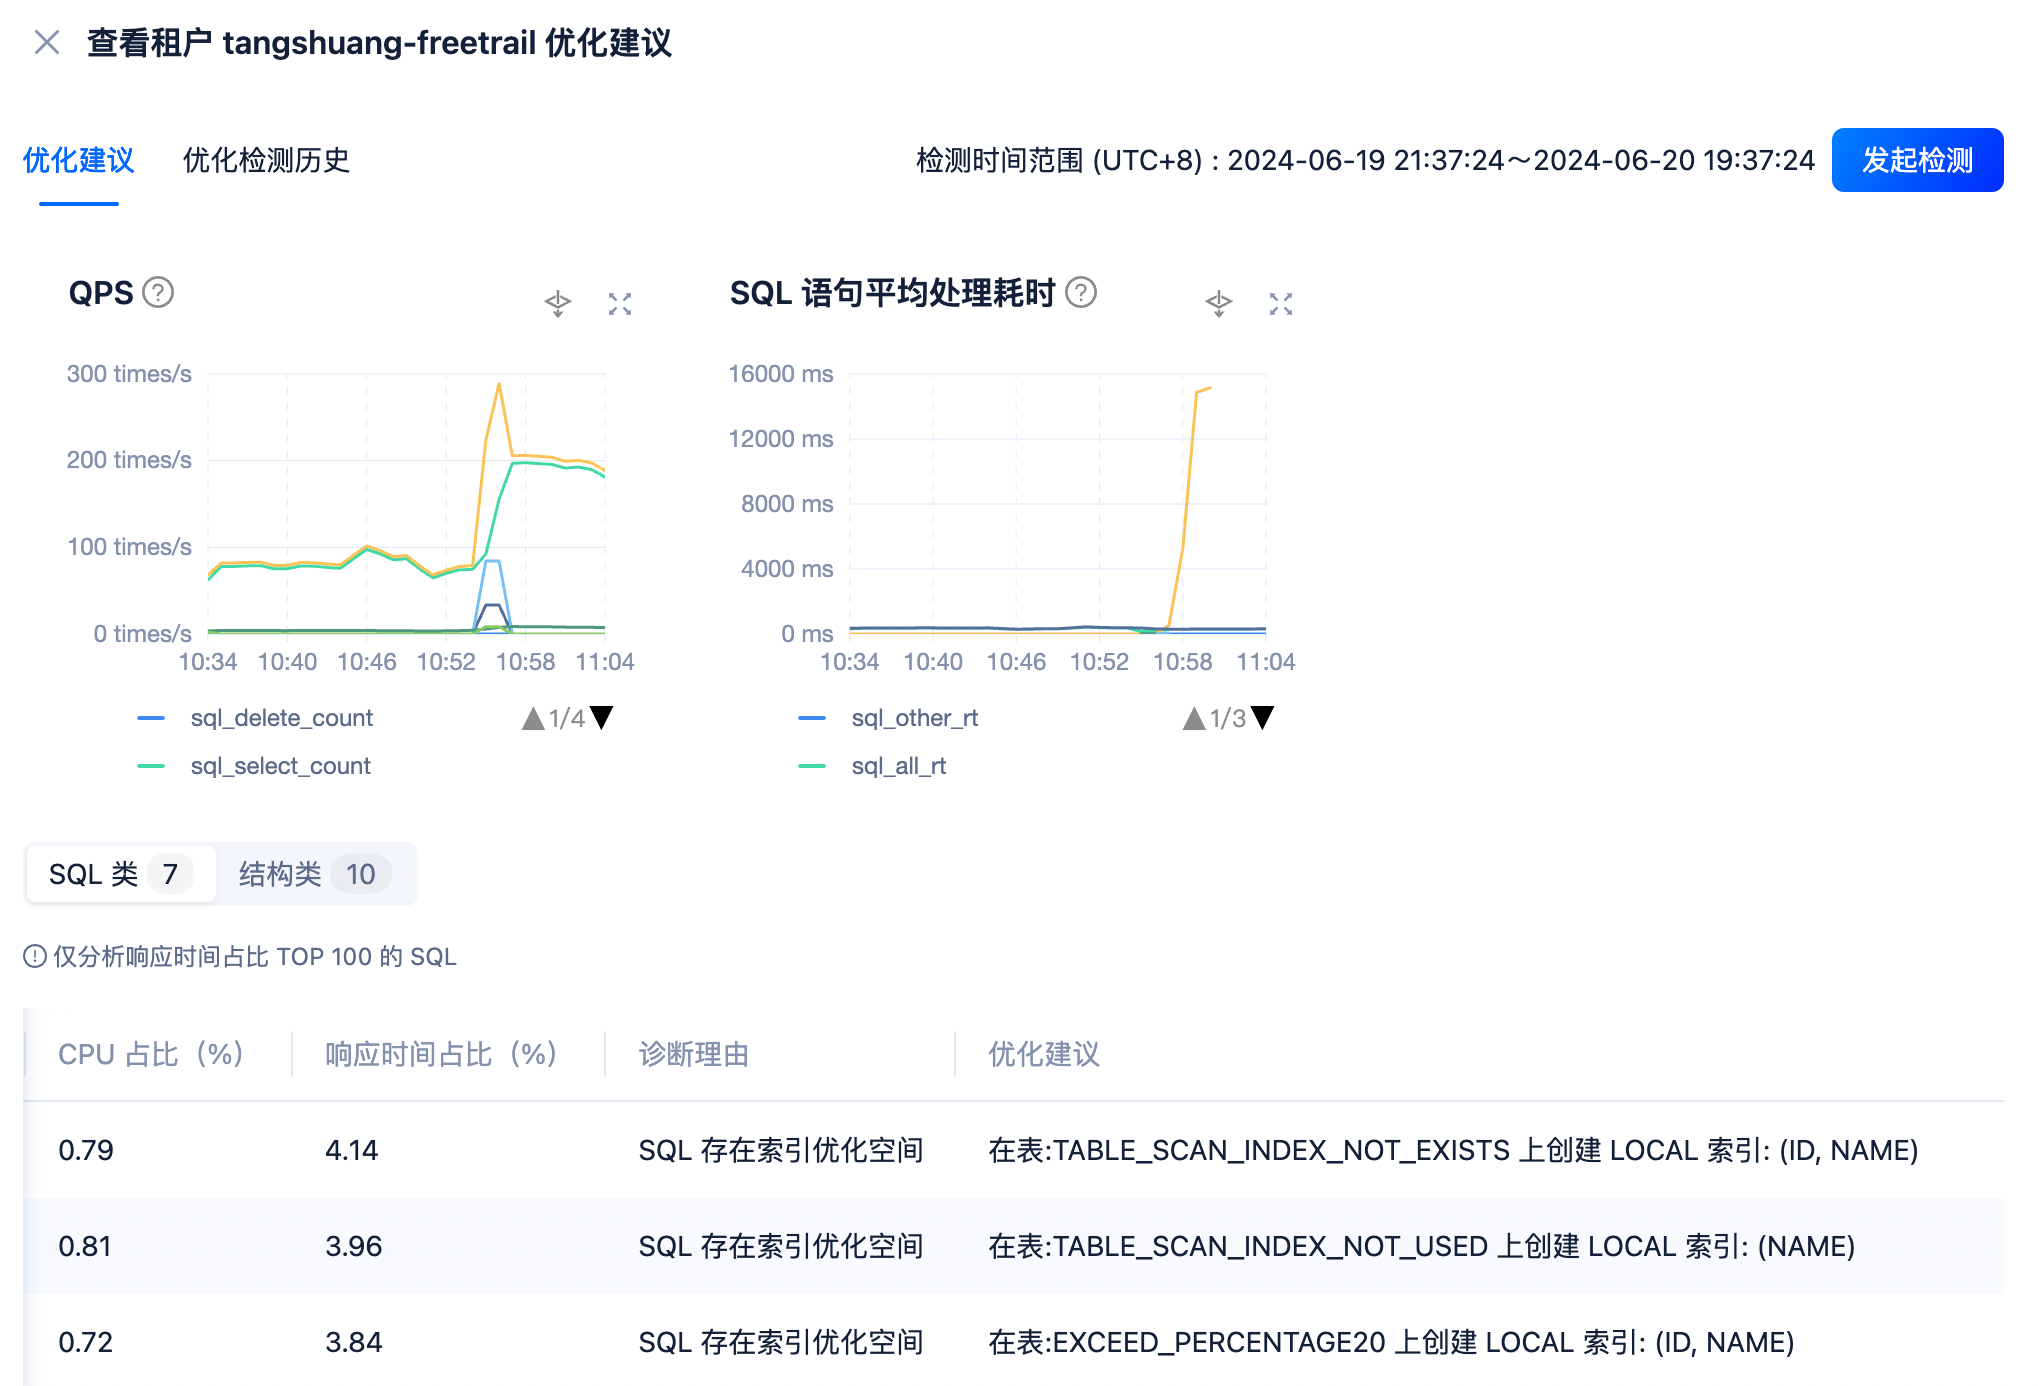
Click Initiate detection in the upper-right corner. In the window that appears, select the Detection Time Range (which cannot exceed 1 day) and click OK.
On the Optimize the detection history tab, view the task status and optimization detection history.