


OceanBase Cloud allows you to monitor the performance of tenants and view monitoring data in the console.
Procedure
Log in to the OceanBase Cloud console.
In the left-side navigation pane, click Instances.
On the Instances page, find the target cluster instance and click the expand icon next to the instance name.
Find the target tenant and click the tenant name.
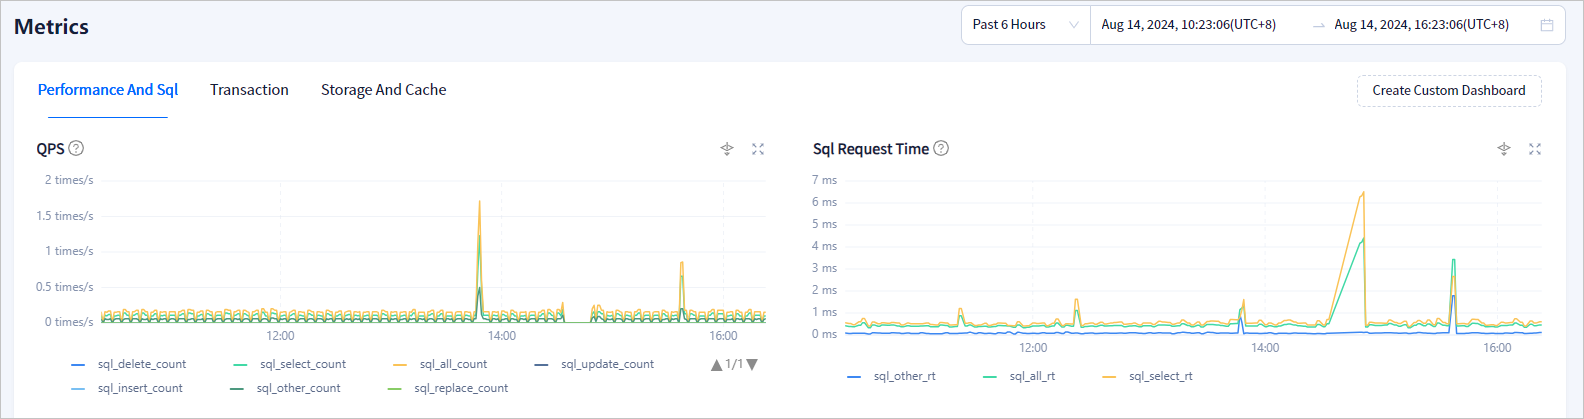
On the Overview page of the tenant, click Metrics in the left-side navigation pane.
On the page that appears, you can view the performance monitoring details of the tenant. You can click the Performance and SQL, Transaction, or Storage and Cache tab to view corresponding monitoring details. For more information, refer to View performance and SQL monitoring details, View transaction monitoring details, and View storage and cache monitoring details.
Common monitoring features
Tenant/Node filtering
You can use the tenant or node filter to select multiple tenants or nodes from the dropdown list to view monitoring data for specific targets.
In monitoring charts with multiple tenants or nodes selected, you can click a tenant name or node name in the chart to show or hide its monitoring information.
Auto refresh
Click the dropdown box next to Auto Refresh at the top of the page to select 15s, 30s, or 60s to configure the auto-refresh frequency of cluster monitoring. Select Off to disable auto-refresh of monitoring data.
Collection frequency
Click the dropdown box next to Period at the top of the page to configure the collection frequency of cluster monitoring, which determines the interval between data collections.
Chart layout
Click the dropdown box next to Layout at the top of the page and select the desired format to change the layout of the current monitoring dashboard.
Time period comparison
Turn on the Compare Time Ranges switch in the upper-right corner to select specific times to compare monitoring data. The solid line represents the baseline period data, and the dashed line represents the comparison period data.
After setting the baseline period, you can use the Previous Period, Same Period Yesterday, and Same Period Last Week buttons to quickly locate times for comparison, or manually edit the period you want to compare.
Chart linkage
Turn on the Link Charts switch in the upper-right corner. When you hover the mouse pointer over a monitoring chart, it will synchronously display the monitoring data for that period in other charts.
Monitoring drill-down
Cluster monitoring drill-down is only supported for single tenants. The drill-down icon is hidden when multiple tenants are selected.
You can select the tenant you want to view in the tenant field, then click the drill-down icon in the monitoring chart to view the breakdown metrics for that monitoring indicator.
Manage alert rules
Click Create Alert Rule in the upper-right corner or View Alert Rule in the right dropdown menu to quickly jump to the corresponding interface in alert management.
Custom dashboard
Click the Custom Dashboard tab to manage custom monitoring dashboards and view monitoring of relevant metrics based on different scenarios. For detailed steps, refer to Customize a monitoring dashboard for a tenant.