


The OceanBase Developer Center (ODC) SQL window provides a user interface for processing data. Within this window, you can evaluate SQL statements, review execution details, and analyze the full execution timeline. This topic uses the employee table as an example to demonstrate how to evaluate SQL queries.
Execution plan
In the SQL window, enter the SQL statement to query the data in the
employeetable.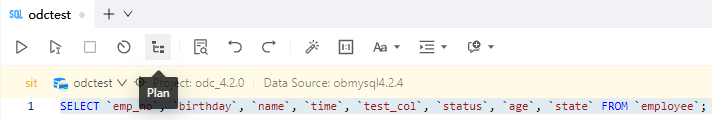
SELECT `emp_no`, `birthday`, `name`, `time`, `test_col`, `status`, `age`, `state` FROM `employee`;As shown in the image above, select the SQL statement and click the Execution Plan icon. This allows you to estimate the execution data before running the SQL statement (EXPLAINPLAN). Note that the estimated execution data may differ slightly from the actual results after execution.
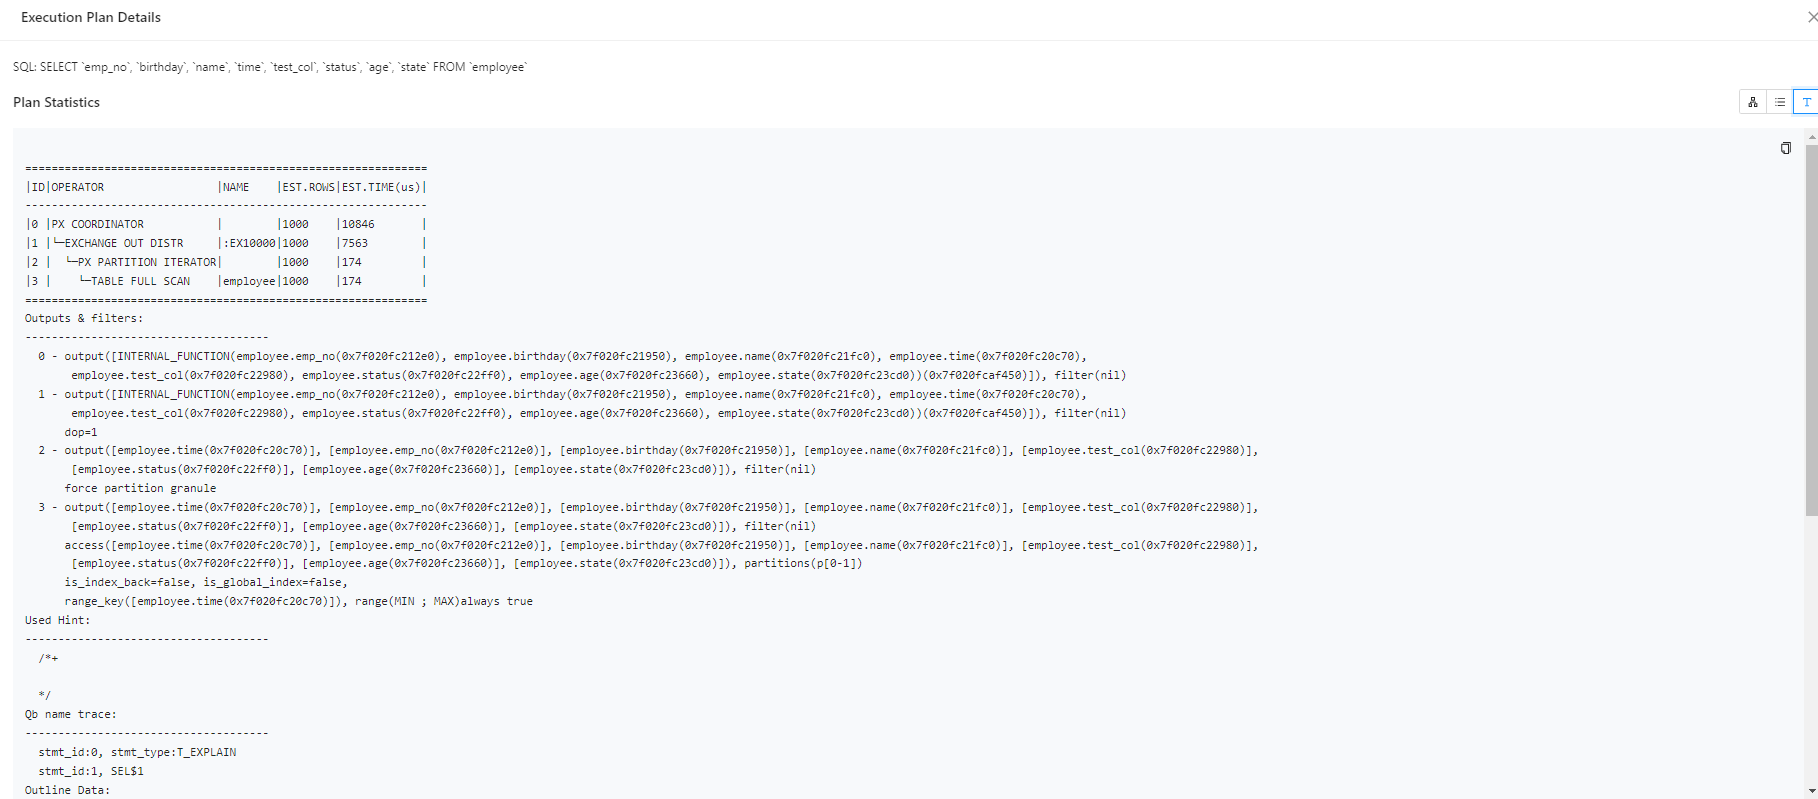
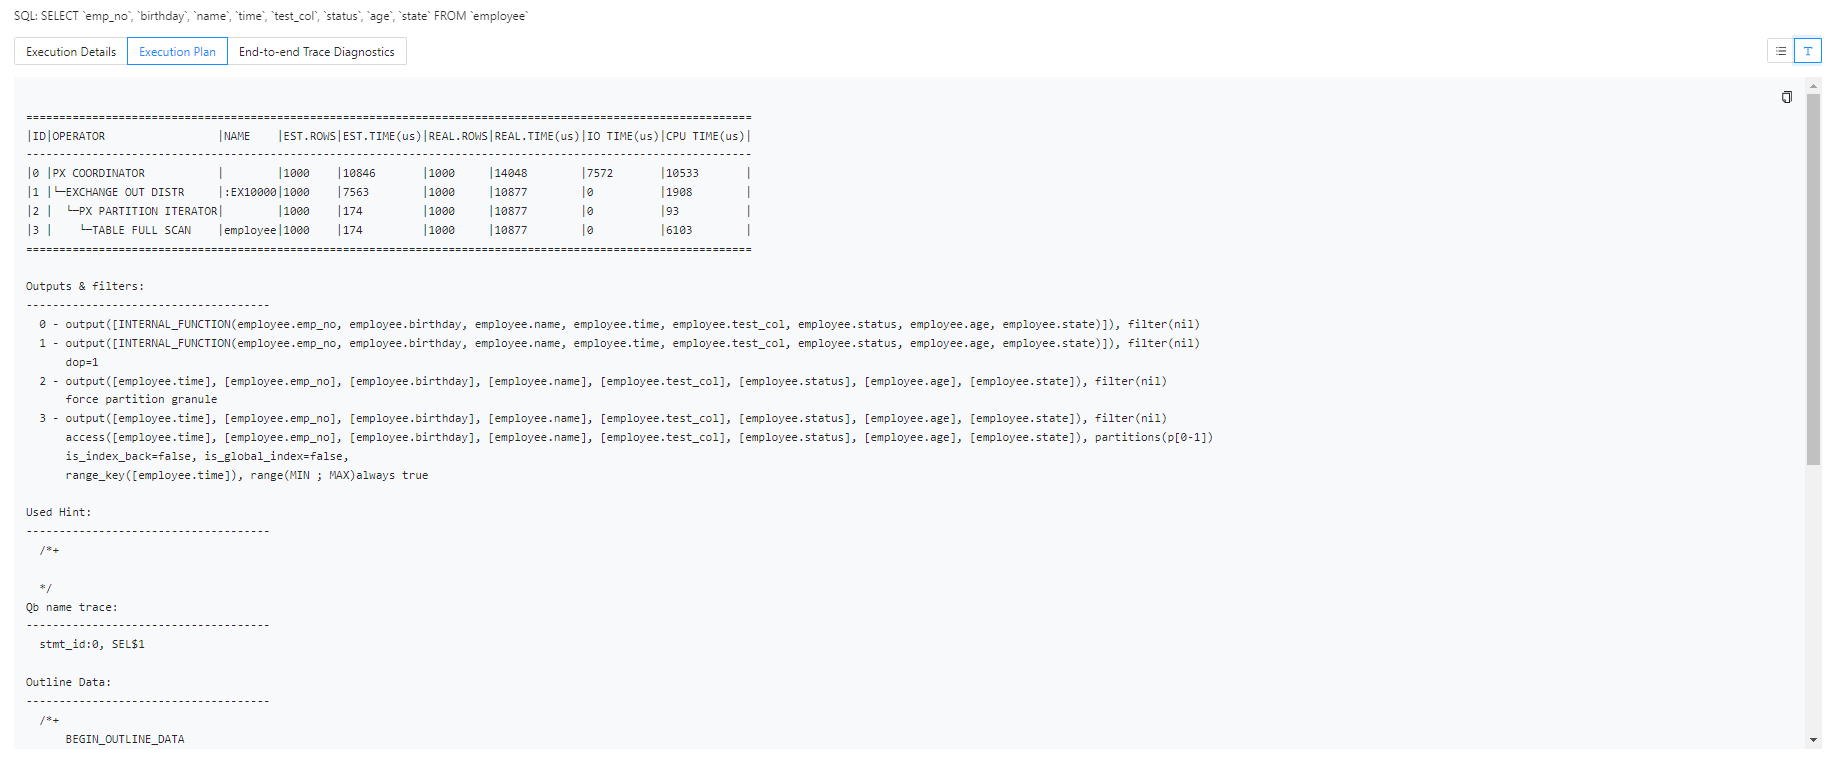
On the Plan Details page, click Text View to switch to a formatted display of the plan.
Execution details
Note
- For OceanBase versions prior to V4.2.4, when executing SQL statements, you can view basic execution details, time statistics, I/O statistics, SQL execution statements, plan statistics, and outlines through the Execution Details tab on the results page.
- For OceanBase V4.2.4 and later, but before OceanBase V4.3.0, or OceanBase V4.3.3.1 and later, you can use the Execution Profile to monitor SQL execution in real-time when executing queries/inserts/updates/deletes/retrieving data from the database. The Execution Profile helps you quickly view execution details and identify performance bottlenecks.
Accessing the execution profile
Option 1: While the SQL statement is executing in the SQL window, click View Execution Profile in the Logs tab.
Notice
If the SQL statement execution time is less than one second, the option to view the execution profile may not be available in the Logs tab.
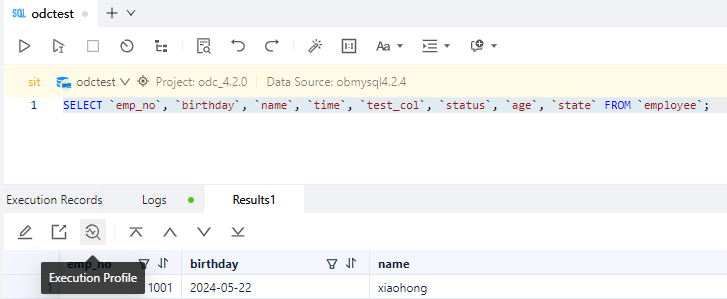
Option 2: After the SQL statement has executed, click the Execution Profile icon in the results.
Option 3: After the SQL statement has executed, click the TRACE ID in the Execution Records tab to access the execution profile.

Execution analysis
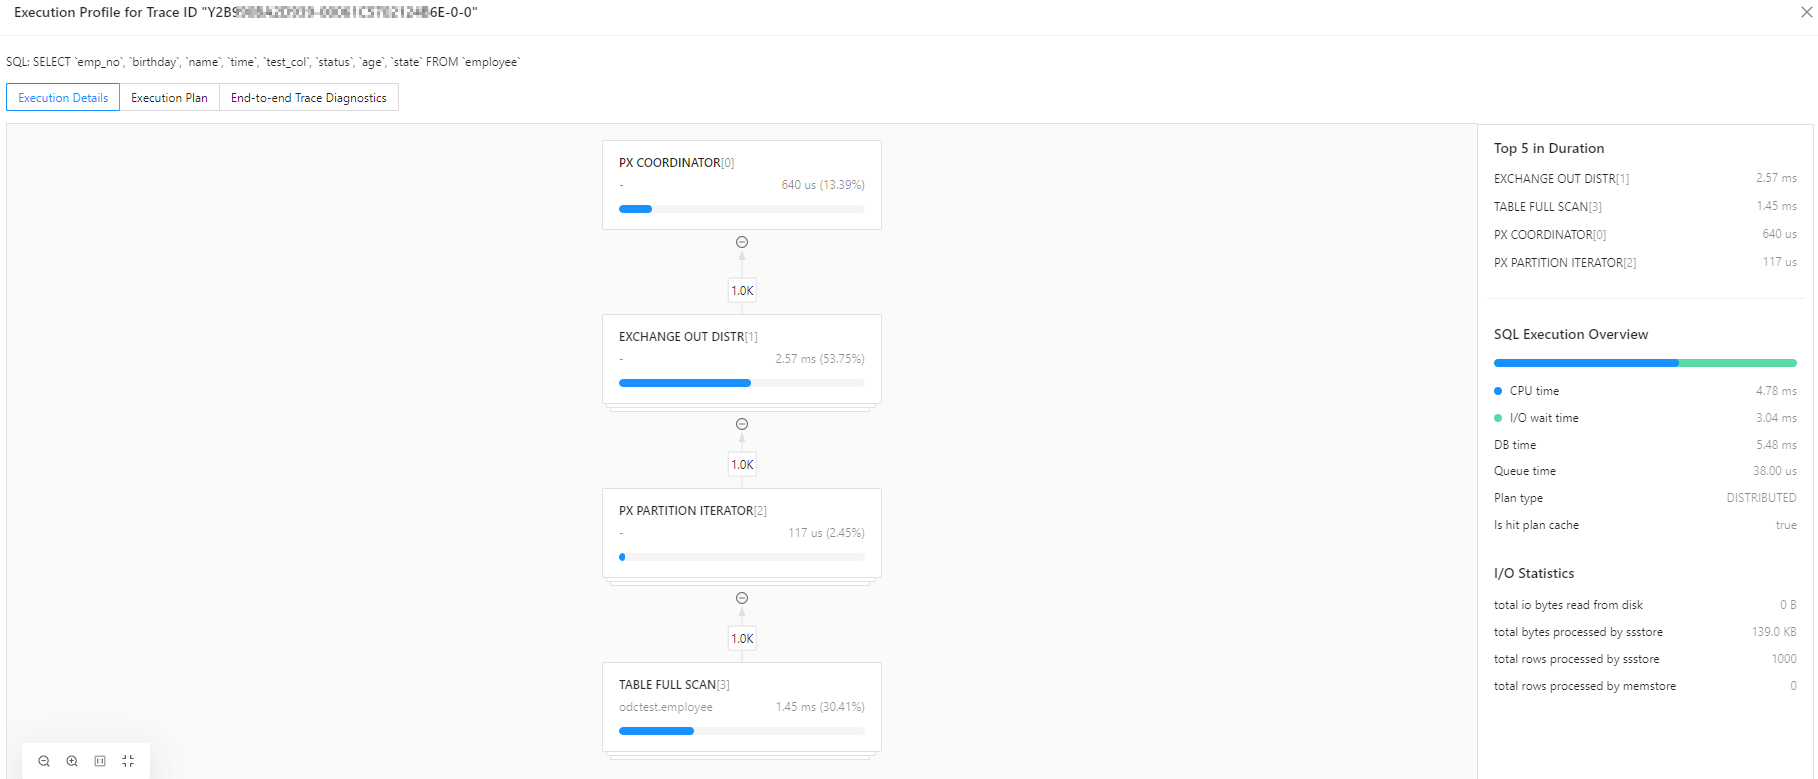
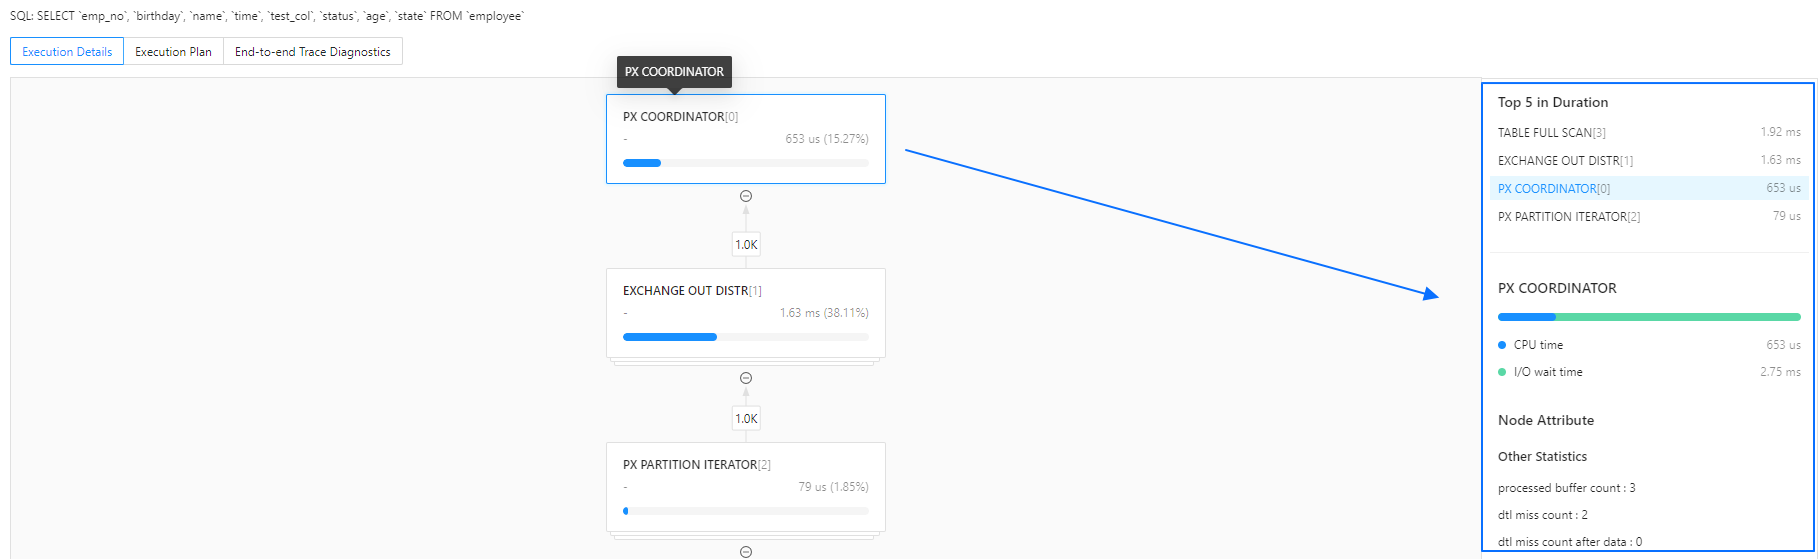
The Execution Details, or Execution Profile, provides a visual representation and data collection for SQL execution plans. It allows real-time monitoring of operator execution status, time details, I/O, and runtime data, while summarizing and ranking the overall execution time.
Using the execution profile, you can:
View the actual execution plan of OceanBase in a graphical format, making it easier to understand the execution sequence and relationships of operators.
Quickly identify execution bottlenecks using execution overviews, real-time I/O statistics, and the top 5 time-consuming operations. ODC sorts these based on CPU time.
Monitor the execution status, timing, and output rows of operators in real-time. By clicking on an operator node, you can access operator attributes, time details, and I/O and other runtime data on the right side of the screen.
Analyze single-node and distributed execution plans. Parallel operators can be sorted by DB time, I/O memory, and output rows to quickly locate data skew.
SQL execution overview
Type |
Description |
|---|---|
| SQL Execution Overview | 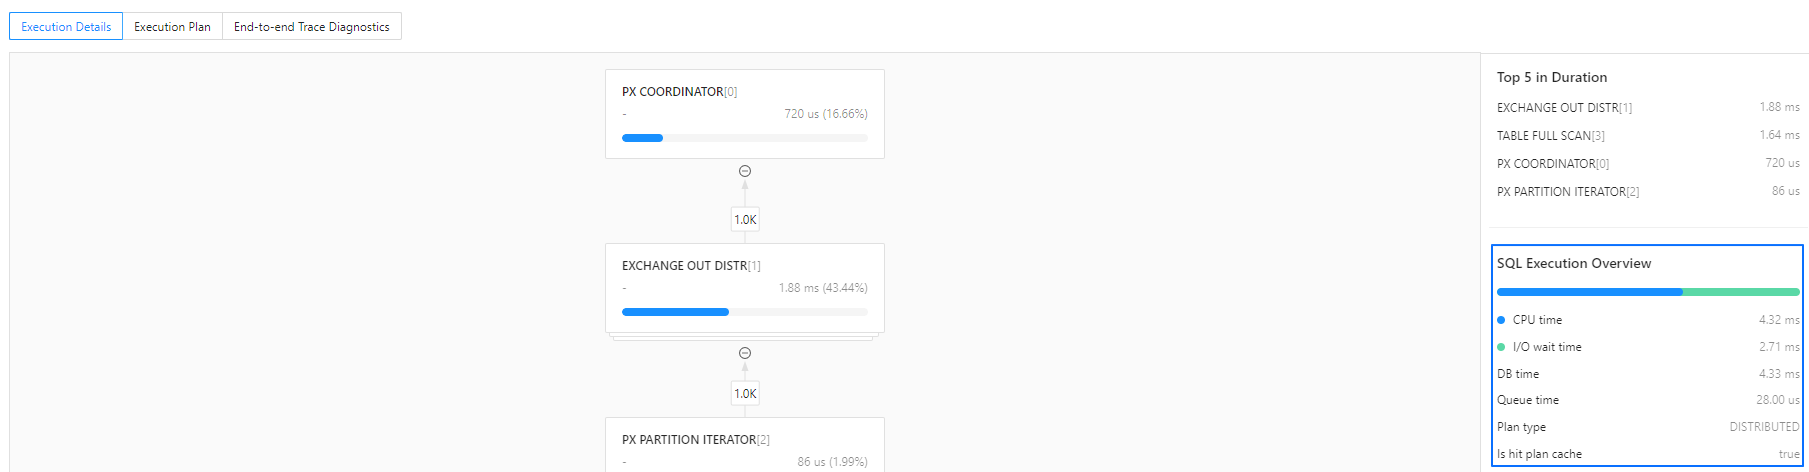
|
| Operator Execution Overview | 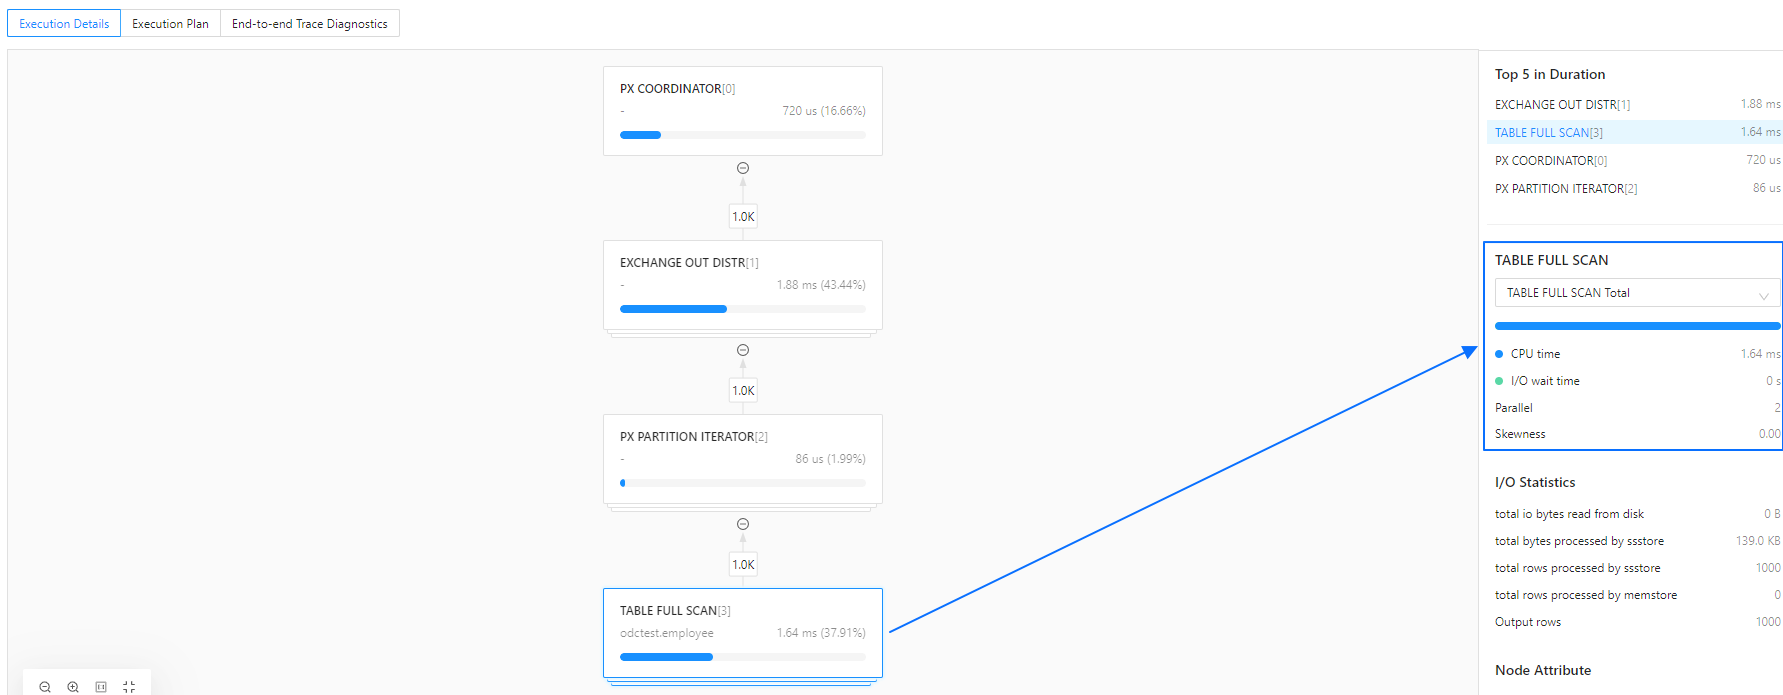
|
I/O statistics
Type |
Description |
|---|---|
| Operator I/O Statistics |
|
Node attributes
Node attributes consist of the output information and runtime data (other statistics) of an operator.
For more details on node output information, refer to the official OceanBase documentation, for example, Table Scan operator's attributes.
Runtime data vary across different operators and represent important monitoring metrics. For more information on these metrics, refer to the V$SQL_MONITOR_STATNAME view.
Execution plan
Unlike the Execution Plan in the SQL window, the Execution Profile displays the actual execution plan, including Actual Rows and Actual Costs. ODC retrieves the current plan using the DBMS_XPLAN package.

You can also click Text View ![]() in the top right corner to switch views and access more detailed plan information, facilitating further SQL optimization.
in the top right corner to switch views and access more detailed plan information, facilitating further SQL optimization.
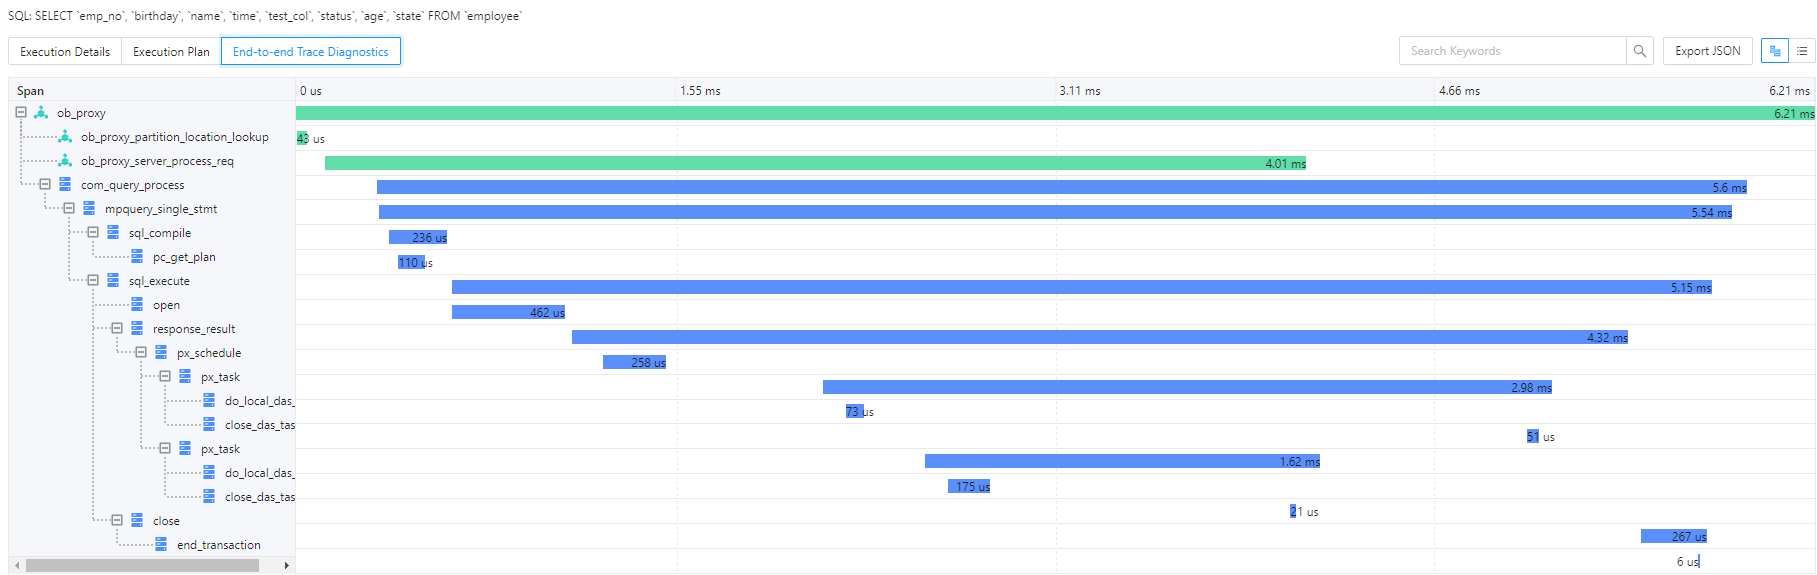
End-to-end trace diagnostics
For OceanBase versions above 4.2.0 (with OBProxy version 4.2.0 or later if connected via OBProxy), ODC supports viewing the information on end-to-end trace diagnostics for SQL. For more details, refer to OceanBase End-to-end Tracing Overview.
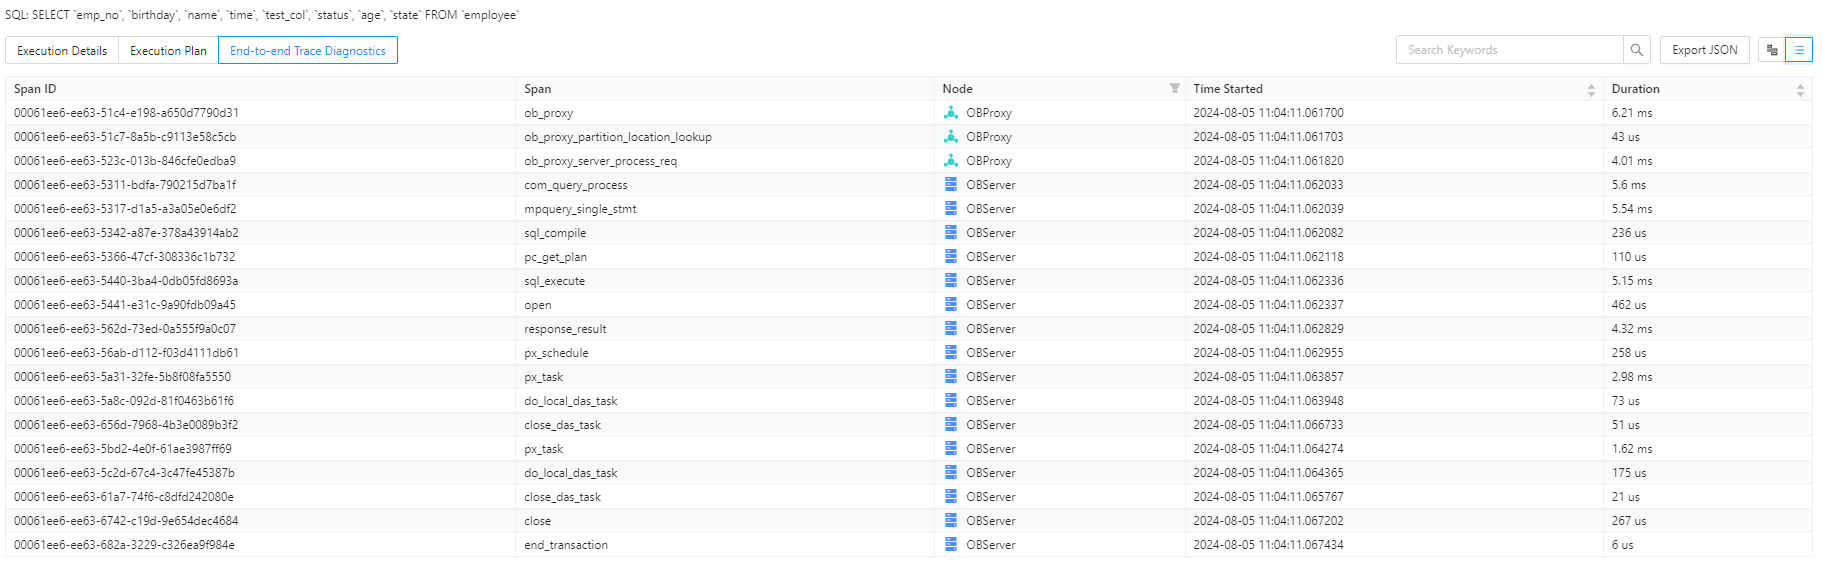
ODC offers both Trace View and Table View visualizations for OceanBase's end-to-end trace diagnostic data.
The Trace View shows the overall SQL execution timeline, with support for node expansion and collapse, as well as search highlighting. Hovering over the timeline allows you to view the execution node, start and end times, and detailed data.
Clicking Table View ![]() allows you to switch views, enabling filtering and sorting of spans across various dimensions.
allows you to switch views, enabling filtering and sorting of spans across various dimensions.
ODC also supports exporting end-to-end trace diagnostic data in JSON format, compatible with the OpenTracing protocol. You can import this data into Jaeger for further analysis.
DB time
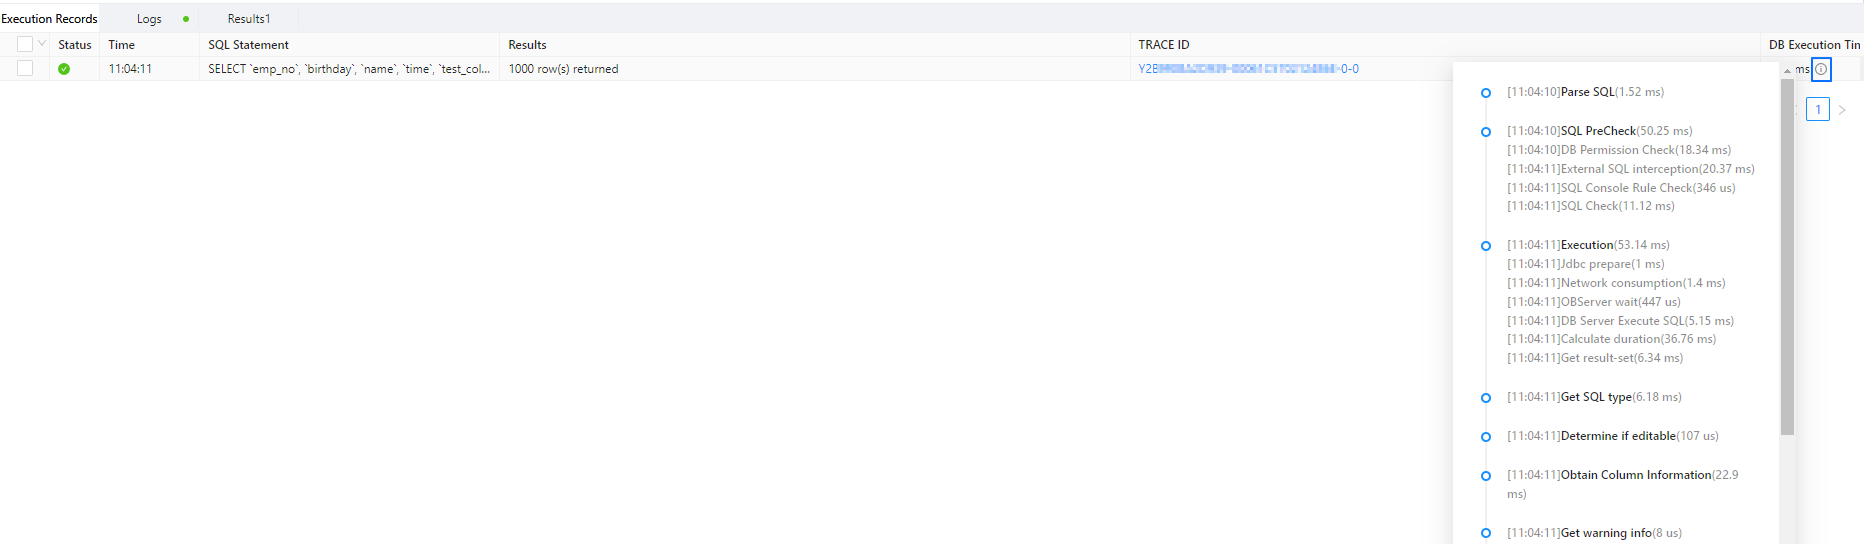
In the Execution Records tab, hover over the tooltip icon next to DB Time to view end-to-end timing information for SQL execution. This helps verify if the time spent in each stage matches the actual execution.