


This topic describes the tenant performance monitoring feature of OceanBase Cloud Platform (OCP).
Prerequisites
The logged-on user in the OCP console is granted the read-only permission on the target tenant.
Procedure
Log on to the OCP console.
In the left-side navigation pane, click Tenants to go to the Tenant Overview page.
In the Tenants list, find the target tenant and click its name.
In the left-side navigation pane on the page that appears, click Performance Monitoring .
In the Data Filtering section, you can filter the performance data to display.
The following table describes the filter conditions.
ConditionDescriptionSelect Time It is not displayed in real-time mode. Select a time range for the data that you want to query. Statistical period Select a statistical period for each data point. Valid values: Per Minute and Per Second , which respectively means one data point per minute and one data point per second. OCP also calculates one more statistical period based on the selected time range to make the number of data points returned approximate 1,440. If the selected time range is long, the statistical period may be longer than one minute. Statistical Range Select a zone or an OBServer in a zone as the statistical range. By default, the monitoring data of all zones is collected. 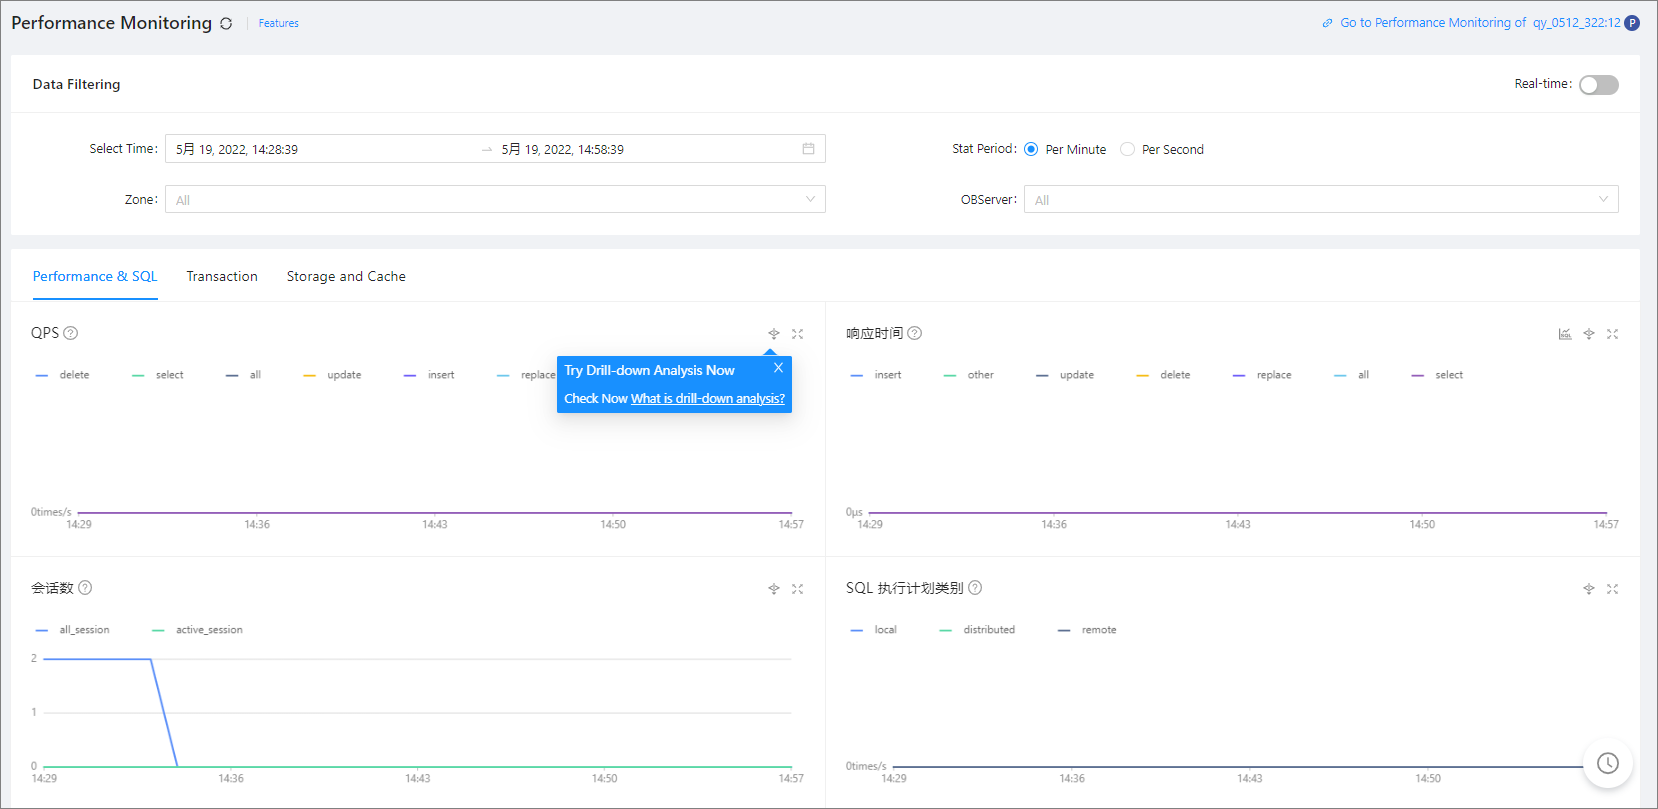
Turn off Real-time : After you specify the filter conditions, the system displays the performance monitoring data based on the specified value of Select Time and Stat Period .
Turn on Real-time : After you specify a statistical range, the system displays the real-time performance monitoring data in the specified statistical range.
Click the Performance & SQL , Transaction , and Storage and Cache tabs to view the corresponding monitoring data of the tenant.
For more information about monitoring metrics, see Monitoring metrics. If you specify multiple OBServers as the statistical range, their aggregate value of each metric is displayed.
Click the Performance & SQL tab to view the SQL execution performance data, including the QPS, response time, number of sessions, SQL execution plan type, wait event, wait time, request wait queue, request queuing time, CPU utilization, MemStore usage in percentage, RPC packet response time, RPC packet throughput, number of opened cursors, and clog synchronization delay.
Click the Transaction tab to view the transaction performance data, including the TPS, transaction response time, number of transaction logs, transaction log volume, transaction log time, lock wait, lock wait time, and number of transactions.
Click the Storage and Cache tab to view the performance data related to the storage and cache, including the MemStore, IOPS, I/O elapsed time, I/O throughput, cache size, cache hit rate, and number of cache requests.
The following features allow you to view and analyze the performance monitoring data on a trend chart in a more efficient manner. You can learn about the features with the help of the figure below.
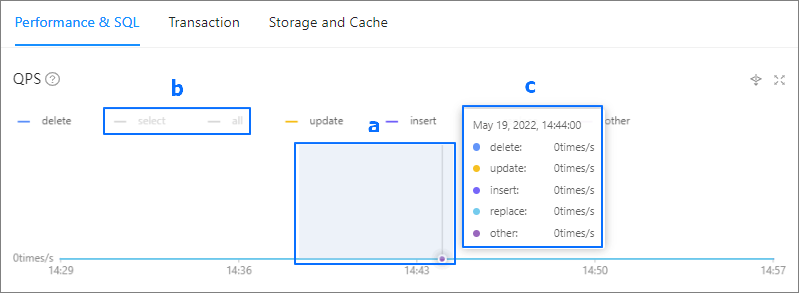
Filter data.
View the trend details of a metric over a specific period of time. To use this feature, drag the pointer over the period of time to select this period of time. Then, the system displays the trend details in a zoomed-in view. After you view the trend details, double-click the trend chart to return to normal.
Hide the data of a submetric. To use this feature, click the icon of the submetric. The submetric will then turn gray and its data will be hidden from the chart.
View data at a specific point in time. To use this feature, move the pointer over this point in time on the trend chart.
Zoom in on the trend chart. To use this feature, click the zoom-in icon in the upper-right corner. The preceding features a , b , and c are also applicable to a zoomed-in chart.
View SQL request analysis. In the Response Time trend chart, click SQL Request Analysis in the upper-right corner to view the request analysis details. For more information, see View request analysis.
Note
SQL request analysis is available only on the Response Time trend chart.
To view monitoring data in different dimensions, perform drill-down analysis. When an abnormal metric exists, such as long response time of a tenant, perform drill-down analysis to identify the faulty server. To view the drill-down analysis details, click the Drill-down Analysis icon in the upper-right corner of the trend chart.
The Performance & SQL tab supports the following drill-down dimensions: tenant > OBServer.
The Transaction tab supports the following drill-down dimensions: tenant > OBServer.
The Storage and Cache tab supports the following drill-down dimensions: tenant > OBServer.
The preceding features a , b , and c are also applicable to a trend chart on a drill-down page. You can also perform the following operations:
In the Data Filtering section of the drill-down page, specify filter conditions. If you do not specify any filter conditions, the drill-down page automatically inherits filter conditions from the upper-level page.
If the metric has submetrics, you can view the submetrics or drill down to other dimensions.
The trend chart can show the SQL statements that are most frequently requested and an entry to the host performance monitoring feature.
To view the TopSQL diagnostic details for the tenant, click the Search for the SQL statement with most requests link. Hover the cursor over the Go to Host Performance Monitoring link and select the desired host to go to the Performance Monitoring page of the host.