


On the Health Inspection page, click Initiate Inspection in the upper-right corner. Then, you can view the basic inspection information and inspection results.
Basic inspection information
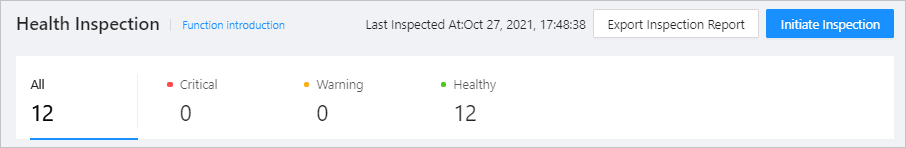
You can view the time of the last inspection and the categories of inspection metrics, which are: Critical, Warning , and Healthy .
Inspection results
The Inspection Results list contains the following columns: Modules, Metrics, Health Status, Result Description , and Inspected At . You can filter the inspection results by the Modules column. 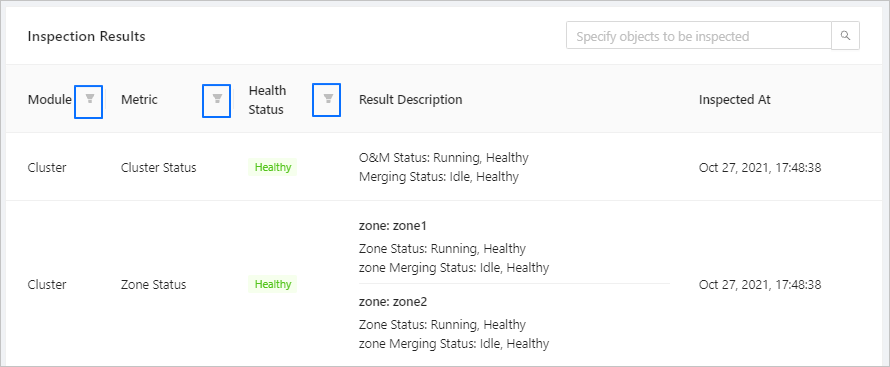
Parameter |
Description |
|---|---|
| Modules | Valid values: Cluster, Host, OB_SERVER, and OB_PROXY. |
| Metrics | Indicates the metrics of the cluster, host, OB_SERVER, and OB_PROXY. For more information, see the following Inspection metrics section. |
| Health Status | Valid values: Critical, Warning, and Healthy. |
| Result Description | Describes in details the inspection result of the host, cluster, OBProxy, zone, and OBServer. |
| Inspected At | Indicates the time when the inspection was initiated. For example, Nov 27, 2020, 17:04:00. |
Export the inspection report
Click Export Inspection Report in the upper-right corner to download the current inspection report.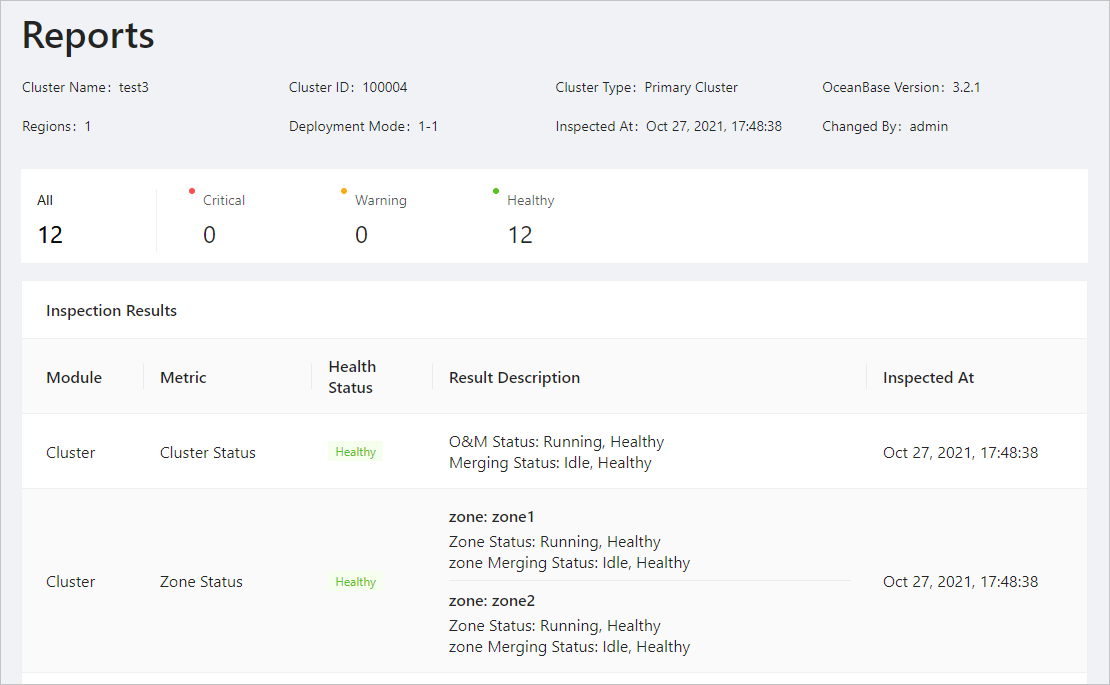
Inspection metrics
Cluster metrics
Inspection metric |
Sub-metric |
Example result |
|---|---|---|
| cluster_status | status: The operation and maintenance status of the cluster. compaction status: The compaction status of the cluster. | status: Running, Healthy Compaction status: Timed Out, Warning |
| zone_status | operation status: The operation and maintenance status of the zone. compaction status: The compaction status of the zone. | zone: zone1 operation status: Creating, Warning compaction status: In Major Freeze, Healthy zone: zone2 operation status: Running, Healthy compaction status: In Major Freeze, Healthy zone: zone3 operation status: Running, Healthy compaction status: In Major Freeze, Healthy |
| alarm | Stopped event count: The number of service stop events. Critical event count: The number of critical-level events. Warning event count: The number of warning-level events. Caution event count: The number of caution-level events. Reminder event count: The number of reminder-level events | Stopped event count: 1, > 0, Critical Critical Alerts: 1, Healthy Warnings: 1, Healthy Only alert levels with at least one corresponding alert are displayed. |
Host metrics
Metric group |
Metrics |
Result description |
|---|---|---|
| host_status | status: The status of the host. agent_status: The status of the agent on the host. | Host: 192.168.1.1 status: Online, Healthy agent_status: Inactive, Critical/Deploying, Warning/Deploying, Warning/Active, Healthy/Active, Healthy |
| host_disk_status | host_disk_used_percent: The percentage of used disk partitions. host_disk_used: The size of used disk partitions. | host: 172.30.181.223 /dev/mapper/vg_ocplog-ob3_clog: Disk Usage: 7GB. Usage Percentage: 4% > 85.0. Healthy /dev/mapper/vg_ocphome-ob10_home (/home/admin): Disk Usage: 125GB. Usage Percentage: 90% > 85.0. Healthy |
OBServer metrics
Metric group |
Metric |
Result description |
|---|---|---|
| server_status | server status: The operation and maintenance status of the OBServer. | OBServer: 172.30.181.224 server status: Inactive, Warning |
| ob_server_disk_status | disk_in_bytes_used: The size of used disk space in the unit of bytes. disk_used_percent: The percentage of used disk space. | OBServer: 172.30.181.224 disk_in_bytes_used: 2G disk_used_percent: 85%, > 72%, Critical; or 70%, Healthy |
| ob_server_partition_count | partition_count: The total number of partition replicas. | OBServer: 172.30.181.224 Replicas: 1478.0 < 100000, Healthy |
OBProxy metrics
Metric group |
Metric |
Result description |
|---|---|---|
| obproxy_status | status: The running status. | OBproxy: 192.168.1.1 Status: Unavailable, Critical/Restarting, Warning |
| obproxy_connection_count | client_session_count: The number of connections between the OBProxy and the client. totol_session_count: The total number of connections of a single OBProxy. | OBproxy: 120.24.12.12 Client connections: 110, less than 8000, Healthy Total connections: 110, less than 58000, Healthy/58500, more than 58000, Critical |