On the Resource Management page of a tenant, you can view the resource usage tendency and the database and table group information of the tenant. You can also view required information by database, table group, table, and partition.
Go to the Resource Management page
Log on to the OceanBase Cloud Platform (OCP) console.
In the left-side navigation pane, click Tenants .
In the Tenants list, find the target tenant and click its name.
The Overview page of that tenant automatically appears.
In the left-side navigation pane, click Resource Management . The Resource Management page of the tenant appears.
You can filter resources to display on this page.
Note
The system collects statistics about the resource usage tendency and database and table group information of the tenant at about 05:00 a.m. every day, three hours later after the major compaction. For a new cluster, no statistical data is displayed on the day when the cluster is created.
Filter by conditions
You can select Database for Condition Range . After you select
Database
, you can select all databases or a specific database, all tables or a specific table, and all partitions or a specific partition in the subsequent fields. After you specify the filter conditions, click Search and view information in the Resource Usage Tendency and Rankings sections.
You can also select Table Groups for filtering. In this case, you can select all table groups or a specific table group, all tables or a specific table, and all partitions or a specific partition.
Note
Tables in the OceanBase system table group are for internal use only. You cannot add tables to this table group. Unlike tables in user-defined table groups, tables in the OceanBase system table group are distributed across three built-in databases.
non_tablegroup indicates a table that does not belong to any table group, and this table is not displayed. To get a table that does not belong to any table group, you must select Database for Condition Range.

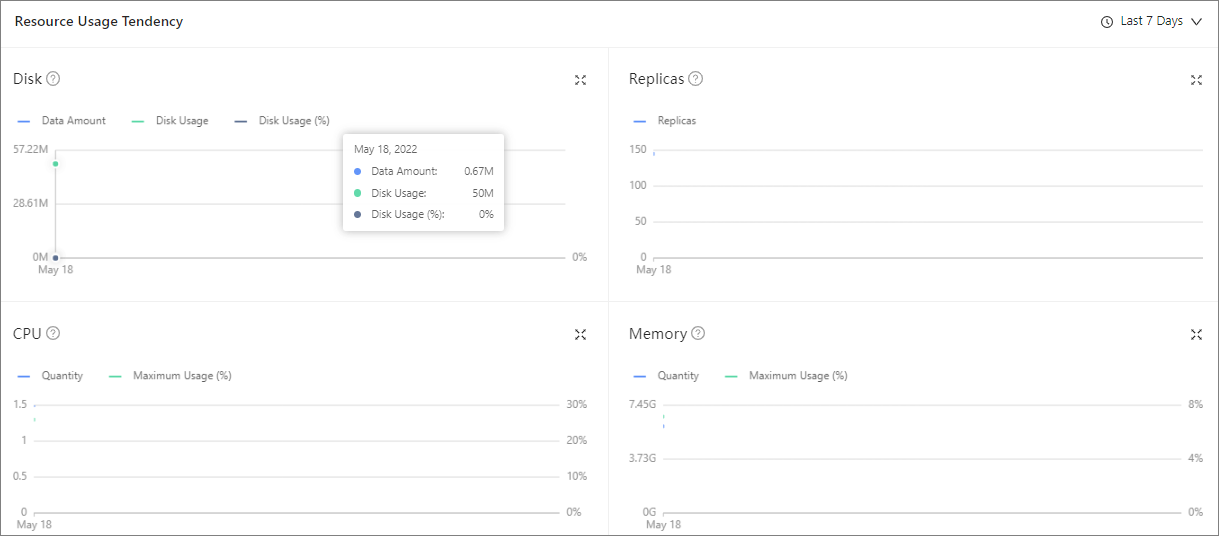
Resource usage tendency
In the Resource Usage Tendency section, you can specify the time range to view the disk, partition replica, CPU, and memory information . The time range can be set to Last 7 Days, Last 1 Month, Last 6 Months, Last 1 Year, or a custom time period. Note
The CPU and memory trend charts are displayed only when you do not specify the search criteria.
Parameter |
Description |
|---|---|
| Disk | Data Amount (GB) Disk Usage (GB) Disk Usage (%) |
| CPU | Quantity (GB) Maximum Usage (%) |
| Memory | Quantity (cores) Maximum Usage (%) |
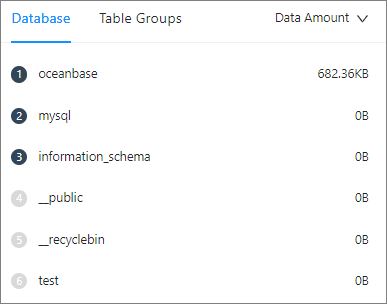
Rankings
You can sort databases and table groups by Data Amount or Disk Usage .