


You can view the performance monitoring data of a cluster in different dimensions.
Prerequisites
The logged-on user in the OceanBase Cloud Platform (OCP) console has the read-only permission on the target cluster.
Procedure
Log on to the OCP console.
The Cluster Overview page automatically appears.
In the Clusters list, find the target cluster and click its name.
In the left-side navigation pane on the page that appears, click Performance Monitoring .
In the Data Filtering section, you can filter the performance data to display.
The following table describes the filter conditions.
Filter conditionDescriptionSelect Time It is not displayed in real-time mode. Select a time range for the data that you want to query. Stat Period It is not displayed in real-time mode. Select the statistical period for each data point. Valid values: Per Minute and Per Second , which respectively means one data point per minute and one data point per second. OCP also calculates one more statistical period based on the selected time range to make the number of data points returned approximate 1,440. If the selected time range is long, the statistical period may be longer than one minute. Statistical Range Select a zone or an OBServer in a zone as the statistical range. By default, the monitoring data of all zones is collected. 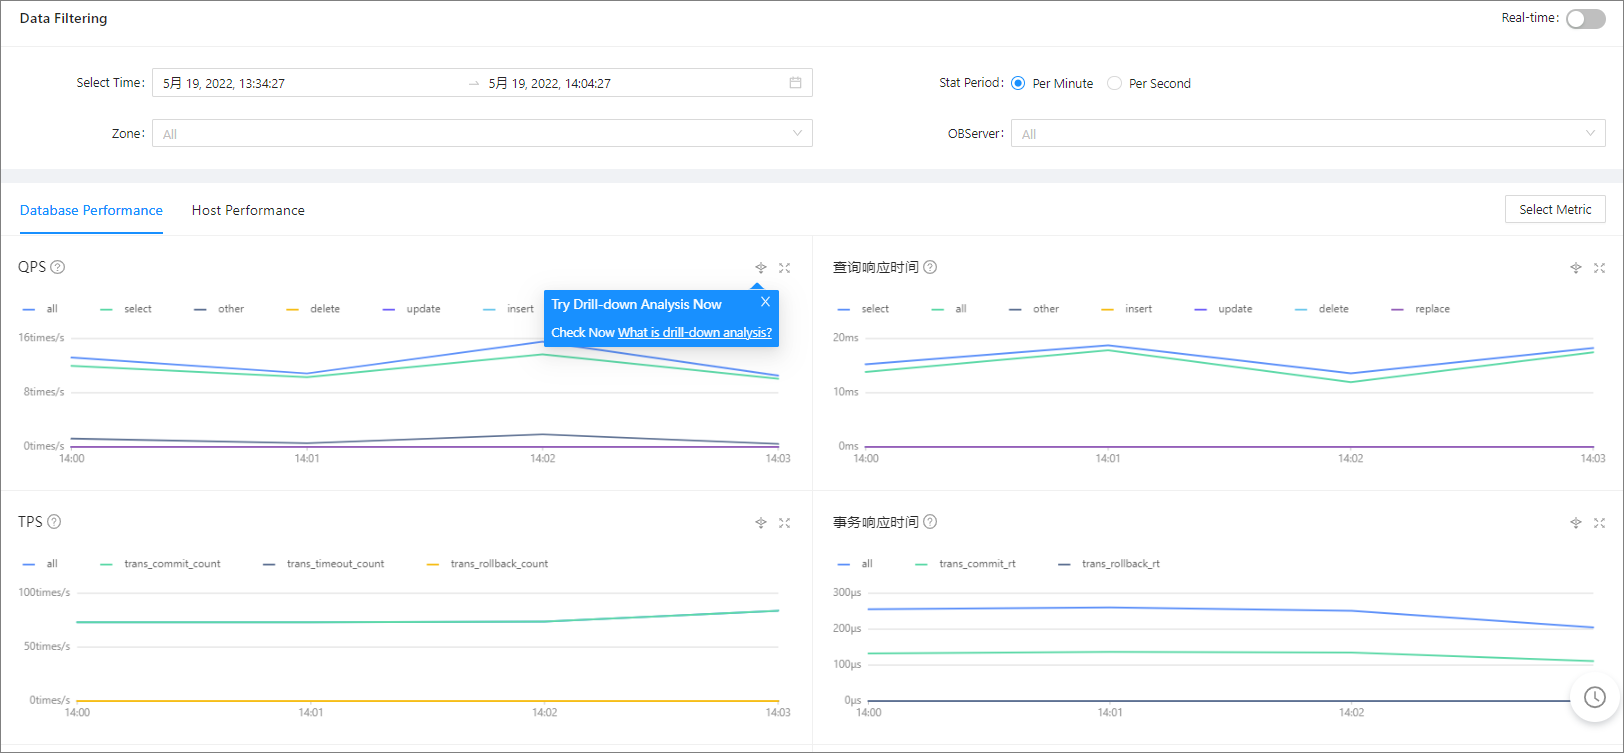
Turn off Real-time : After you specify the filter conditions, the system displays the performance monitoring data based on the specified value of Select Time and Stat Period .
Turn on Real-time : After you specify a statistical range, the system displays the real-time performance monitoring data in the specified statistical range.
View the performance monitoring data on the Database Performance and Host Performance tabs.
For more information about monitoring metrics, see Monitoring metrics.
Click the Database Performance tab.
To display other metrics, click Select Metric on the right side and select the metrics to display in the Select Metric panel. The system can display up to 10 metrics.
Click the Host Performance tab.
If multiple OBServers are specified as the statistical range, their aggregate value of each metric is displayed.
The following features enable you to better view and analyze the performance monitoring data on a trend chart. You can learn about the features with the help of the figure below.
 Note
Note
The drill-down feature is available on the Performance Monitoring page of a cluster or tenant but is not available on the Monitoring page of a host.
View the trend details of a metric over a specific period of time. To use this feature, drag the pointer over the period of time to select this period of time. Then, the system displays the trend details in a zoomed-in view. After you view the trend details, double-click the trend chart to return to normal.
Hide the data of a submetric. To use this feature, click the icon of the submetric. The submetric will then turn gray and its data will be hidden from the chart.
View data at a specific point in time. To use this feature, move the pointer over this point in time on the trend chart.
Zoom in on the trend chart. To use this feature, click the zoom-in icon in the upper-right corner. The preceding features ①, ②, and ③ are also applicable to a zoomed-in chart.
To view monitoring data in different dimensions, perform drill-down analysis. When an abnormal metric exists, such as long response time of a tenant, perform drill-down analysis to identify the faulty server. To use this feature, click the Drill-down Analysis icon in the upper-right corner of the trend chart.
The Database Performance tab supports the following drill-down dimensions: cluster > tenant > OBServer.
The Host Performance tab supports the following drill-down dimensions: cluster > host.
The preceding features ①, ②, and ③ are also applicable to a trend chart on a drill-down page. You can also perform the following operations:
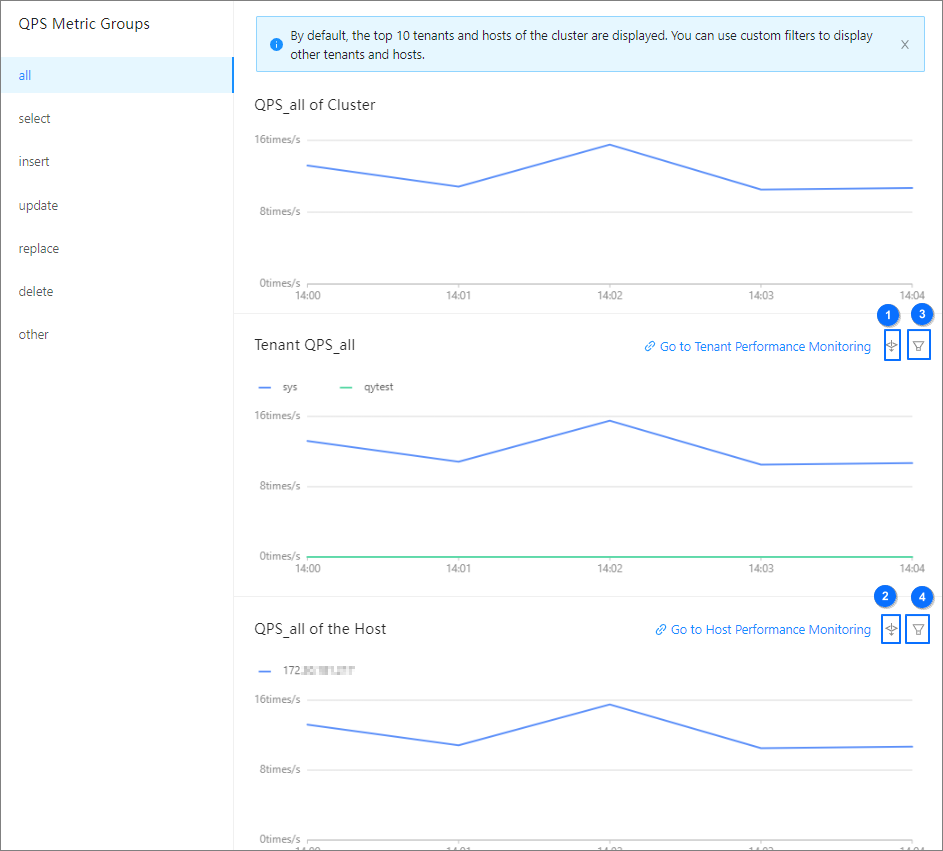
In the Data Filtering section of the drill-down page, specify filter conditions. If you do not specify any filter conditions, the drill-down page automatically inherits filter conditions from the upper-level page.
If the metric has submetrics, you can view the submetrics or click ① or ② to drill down to other dimensions for further analysis.
If the metric is involved in the performance of a tenant or host, you can directly go to the Monitoring page of the tenant or server from the trend chart.
To go to the Performance Monitoring page of the tenant, move the pointer over the Go to Tenant Performance Monitoring link in the upper-right corner of the trend chart, and then select and click the tenant.
To go to the Monitoring page of the host, hover the pointer over the Go to Host Performance Monitoring link in the upper-right corner of the trend chart, and then select and click the host.
You can also click the button in section ③ or ④ in the upper-right corner of the trend chart to select the tenant or host whose data needs to be displayed on the trend chart.
(Optional) Configure the monitoring data collection interval.
By default, OCP collects monitoring data per second. This collection interval has high requirements for the OCP server performance and MonitorDB storage performance. If you do not require a high collection frequency, you can change the value of the ocp.metric.collect.interval.second parameter in the config_properties file to increase the monitoring data collection interval, thus reducing required resources and increasing the manageable scale. Note
The system supports only the following values for this parameter: 1, 5, 10, and 15. If the value you entered is not one of them, the system adjusts the value based on the following rules:
If the entered value is smaller than 1, it is adjusted to 1.
If the entered value is in the range of [1,5), it is adjusted to 1.
If the entered value is in the range of [5,10), it is adjusted to 5.
If the entered value is in the range of [10,15), it is adjusted to 10.
If the entered value is greater than 15, it is adjusted to 15.
After you change the value, the configuration immediately takes effect. OCP collects monitoring data at this new interval. By default, the monitoring data display interval is three times the monitoring data collection interval, except for the case when the collection interval is 1 second. For example, if the monitoring data is collected every 5 seconds, the queried monitoring data is displayed by an interval of 15 seconds.