


This topic describes how to view the resource usage tendency of the current cluster.
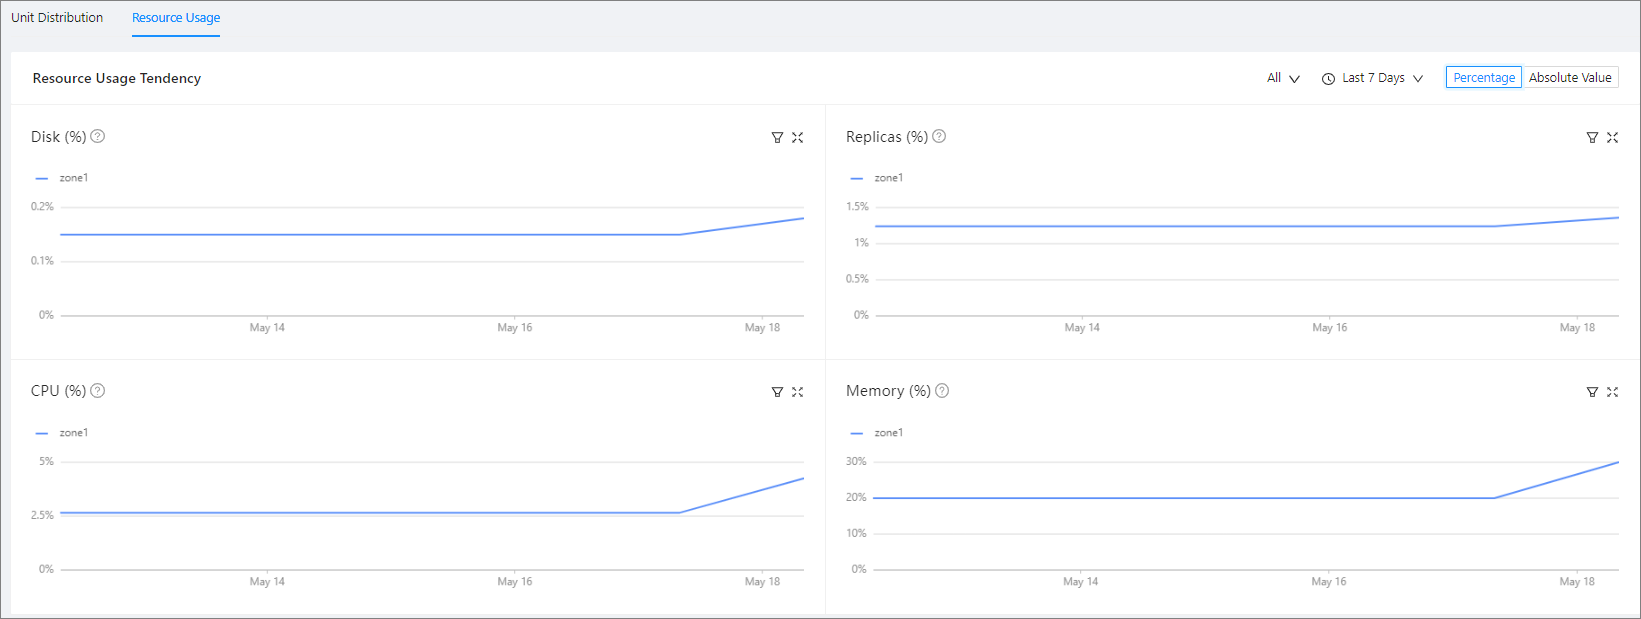
In the Resource Usage Tendency section, you can view the Disk, Replicas, CPU , and Memory trend charts. The CPU and Memory trend charts display the trend of resource allocation, and the Disk and Partitions trend charts display the trend of resource usage. You can move the pointer over a resource change point in time on the CPU utilization or memory usage curve, to view the resource change event of resource allocation at the current point in time relative to the previous point in time. The event information is generated based on the value differences between the two resource allocations and may not include all associated events.
Note
Resource usage trend data is collected once every day to display trends of resource allocation and usage. It is not suitable for observing the real-time changes of resources.
Click All in the upper-right corner, and choose All, Zone1, Zone2 , or Zone3 from the drop-down list to view the resource usage trends in different scopes.
Click Last 7 Days in the upper-right corner, and choose Last 7 Days, Last Month, Last Six Months, or Last Year to view the resource usage trends in different time periods.
Click Percentage or Absolute Value to switch the mode of the trend charts.
Click the filter icon in the upper-right corner of each trend chart to view the resource usage of different zones.
The table in the Allocated Resources section contains the following columns: Tenant Name, Used Disks, Replicas, Allocated CPU (Core) , and Allocated Memory (G) . Click the name of a tenant to go to the overview page of the tenant.
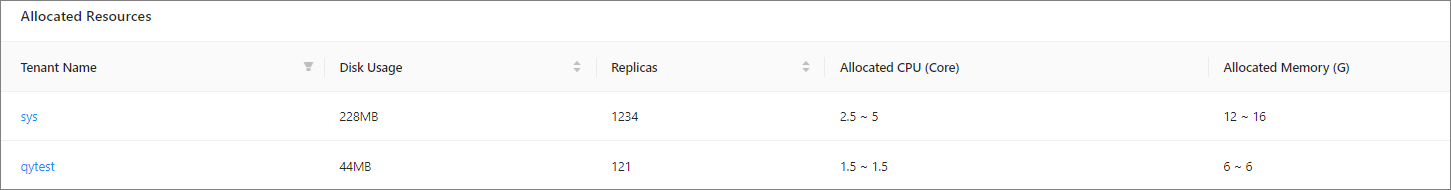
Note
Due to high query costs, the query results of tenant resource allocation statistics are returned based on cached data. This may result in a 2-minute lag with the real-time condition. In this case, for the allocated resources that do not belong to any tenant, N/A is displayed in the Tenant Name column, indicating that such resources can be released.