SQL issues are the most common type of performance issues. OceanBase Cloud Platform (OCP) provides the following SQL diagnostics features based on characteristics of SQL statements: Suspicious SQL, TopSQL, SlowSQL, and ParallelSQL. OCP also provides the index binding feature to help you optimize SQL statements online.
Suspicious SQL
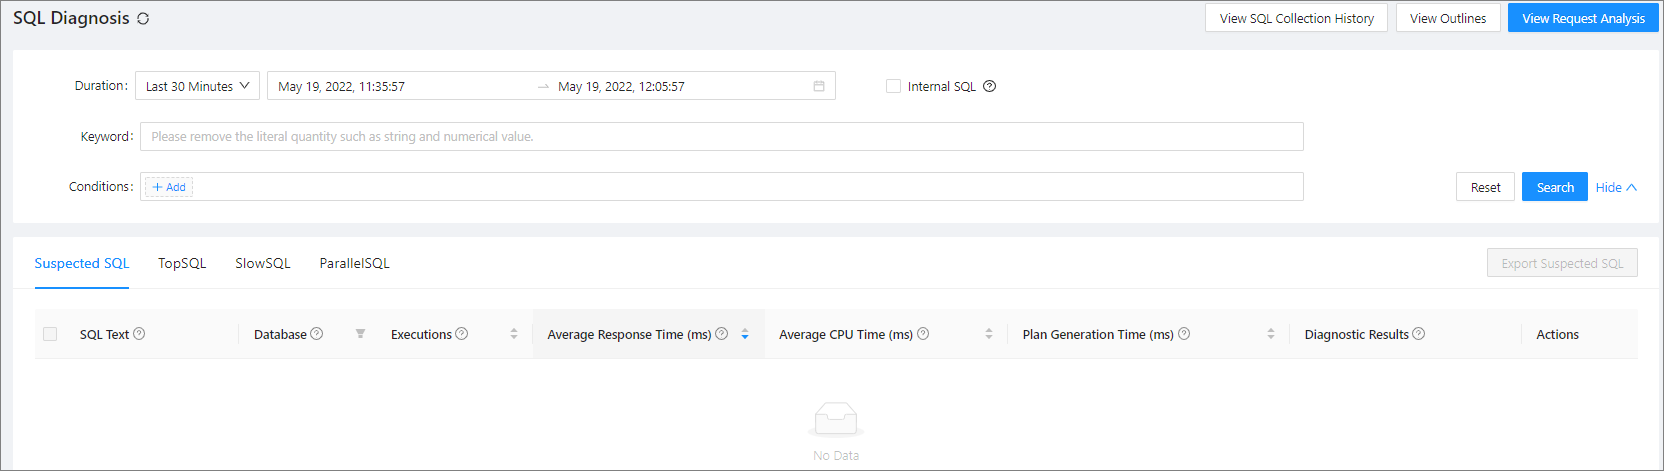
Suspicious SQL displays the SQL statements whose performance is deteriorated and whose execution plans are modified. You must take these SQL statements seriously. The diagnosis result of a suspicious SQL statement includes the cause to the performance deterioration.
View suspicious SQL statements
The Suspected SQL list displays the information of all suspicious SQL statements, including the SQL text, database, executions, average response time, average CPU time, plan generation time, and diagnosis result. You can copy the SQL text and filter the SQL statements by database. You can also sort the suspicious SQL statements the number of by executions, average response time, average CPU time, and plan generation time.
Manage suspicious SQL statements
You can manage suspicious SQL statements. For more information, see Suspicious SQL diagnostics.
TopSQL
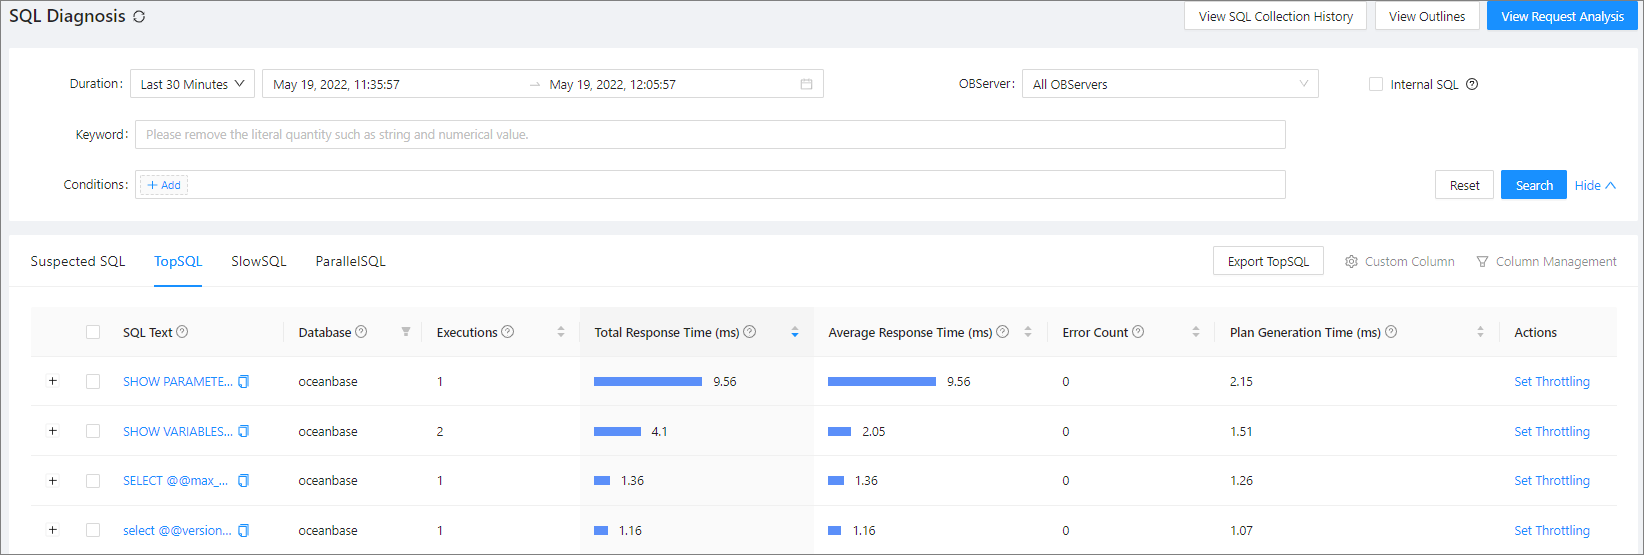
TopSQL displays the SQL statements with the longest average execution time.
View TopSQL statements
The TopSQL list displays the information of all top SQL statements, including the SQL text, database, executions, total response time, average response time, error count, and plan generation time. You can copy the SQL text and filter the SQL statements by database. You can also sort the SQL statements by the number of executions, total response time, average response time, error count, and plan generation time.
Manage TopSQL statements
You can manage TopSQL statements. For more information, see TopSQL diagnostics.
SlowSQL
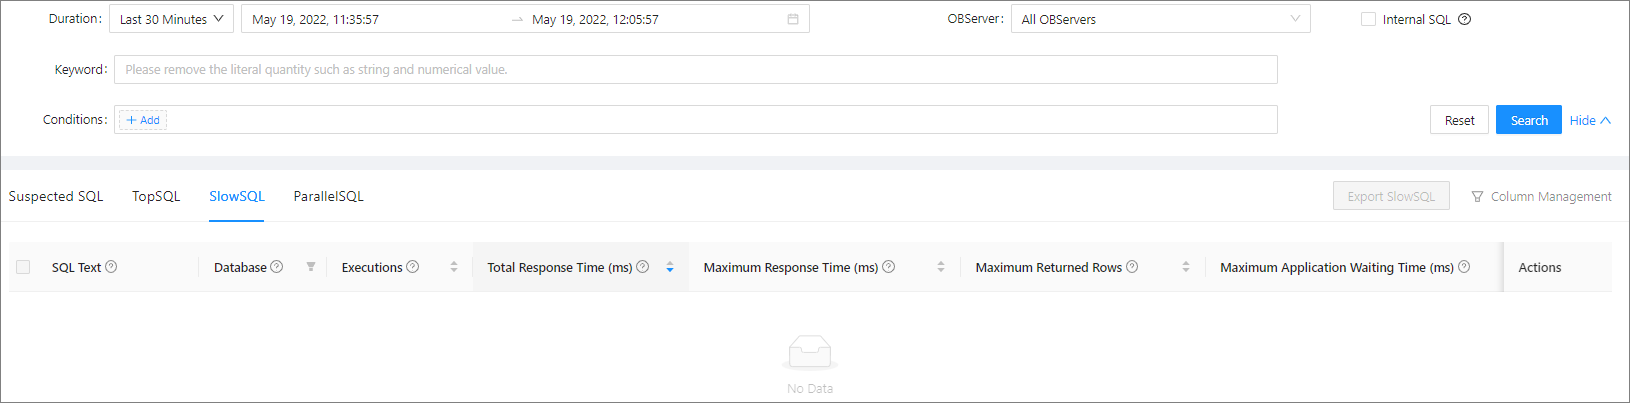
SlowSQL displays the SQL statements whose response time is longer than 100 ms.
View SlowSQL statements
The SlowSQL list displays the information of all slow SQL statements, including the SQL text, database, executions, total response time, maximum response time, maximum returned rows, maximum application latency, and maximum physical reads. You can copy the SQL text and filter the SQL statements by database. You can also sort the SQL statements by the number of executions, total response time, maximum response time, maximum returned rows, maximum application latency, and maximum physical reads.
Manage SlowSQL statements
You can manage SlowSQL statements. For more information, see SlowSQL diagnostics.
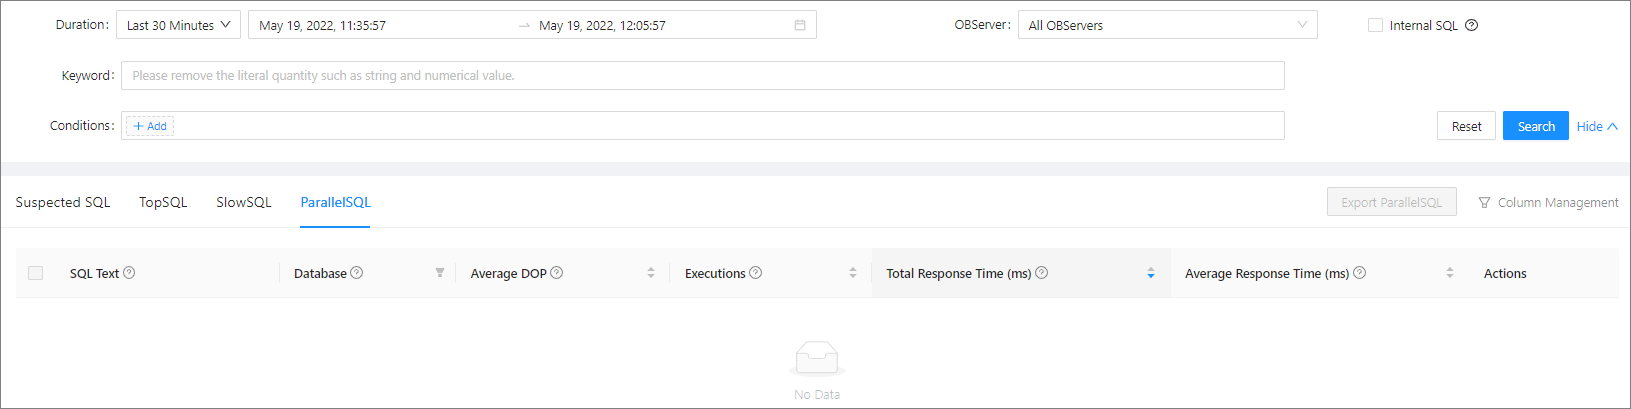
ParallelSQL
ParallelSQL displays the SQL statements that involve multiple server nodes in a single execution.
View ParallelSQL statements
The ParallelSQL list displays the information of all ParallelSQL statements, including the SQL text, database, concurrency, executions, total response time, and average response time. You can copy the SQL text and filter the SQL statements by database. You can also sort the SQL statements by the number of executions, total response time, maximum response time, maximum returned rows, maximum application latency, and maximum physical reads.
Manage ParallelSQL statements
You can manage ParallelSQL statements. For more information, see ParallelSQL diagnostics.
View the SQL collection enable/disable history
OCP allows you to view the SQL collection enable/disable history. For more information, see View the SQL collection enable/disable history.
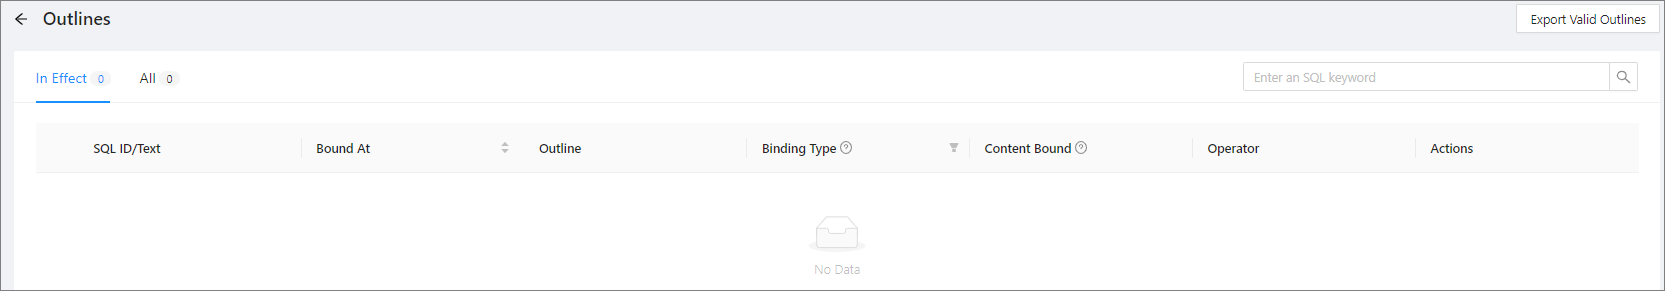
View outlines
On the Outlines page, you can view outlines of an OceanBase Database tenant, including the outlines for throttling, execution plan binding, and index binding. You can disable throttling or unbind the execution plan for an effective outline. You can view related SQL details and export effective outlines. On the All tab, you can view information of all outlines that were created or deleted in OCP in the past 30 days. For more information, see View outlines.
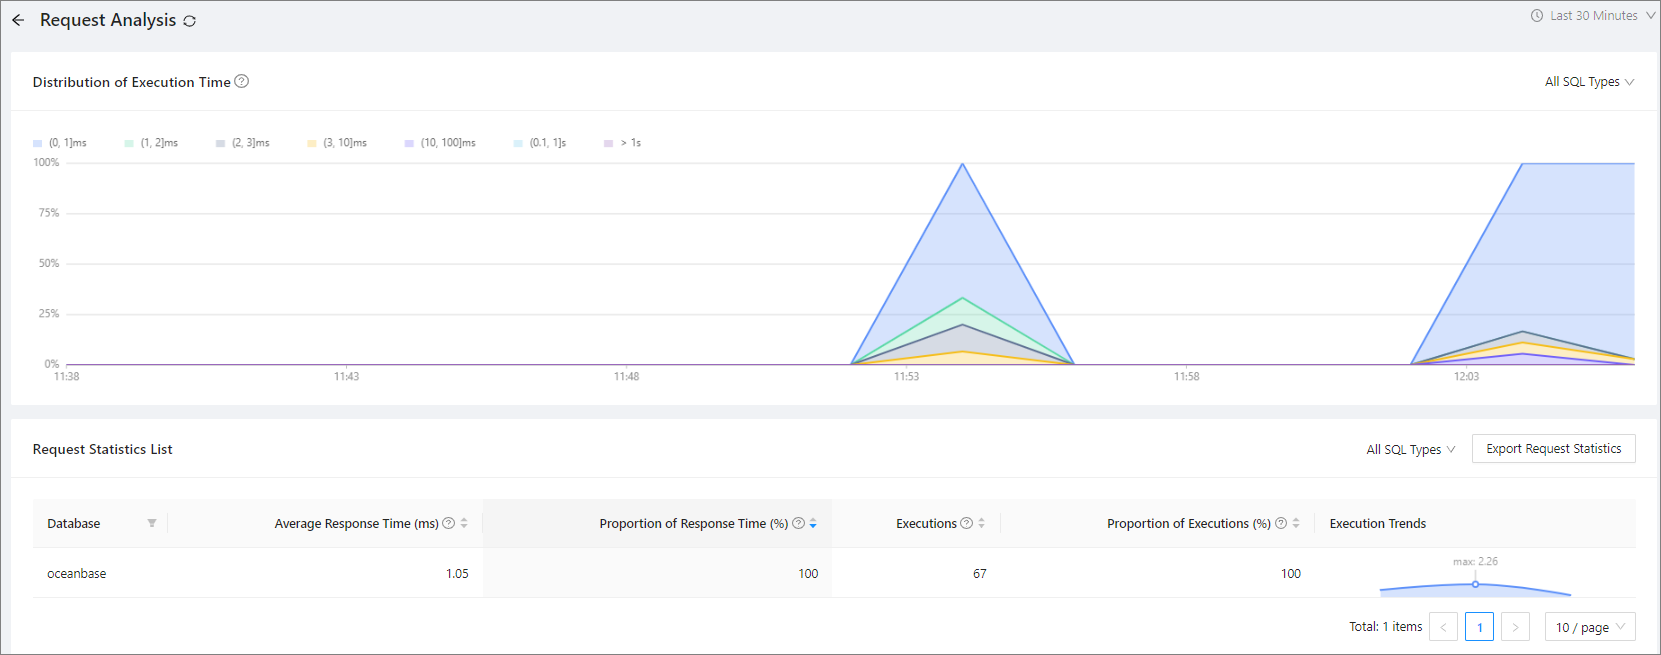
View request analysis
The Request Analysis page displays the execution time distribution of different types of SQL statements and the request statistical table, which help you understand the overall SQL statement execution status. You can also export the request statistical table. For more information, see View request analysis.