


On the details page of a cluster, you can view its basic information, resource usage, alerts, system events in the last 7 days, zones, and OBServers, and perform routine maintenance operations.
View the basic information
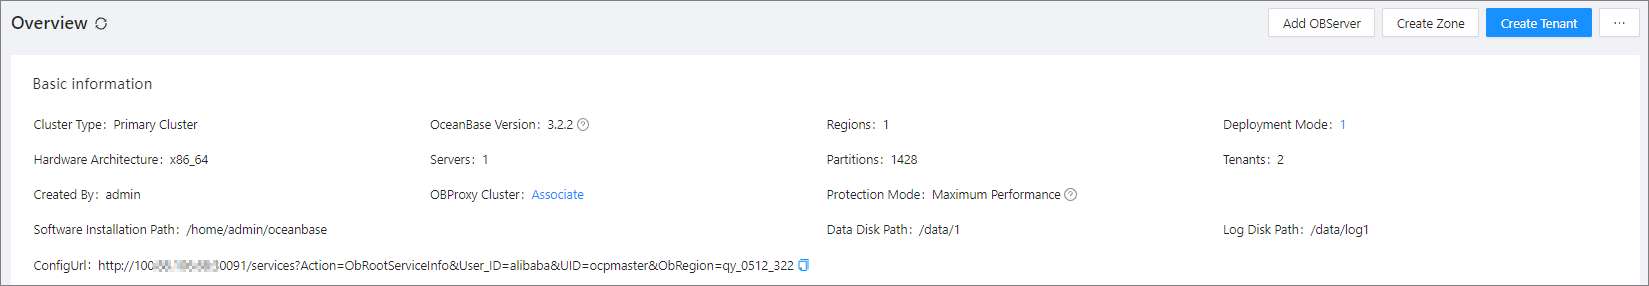
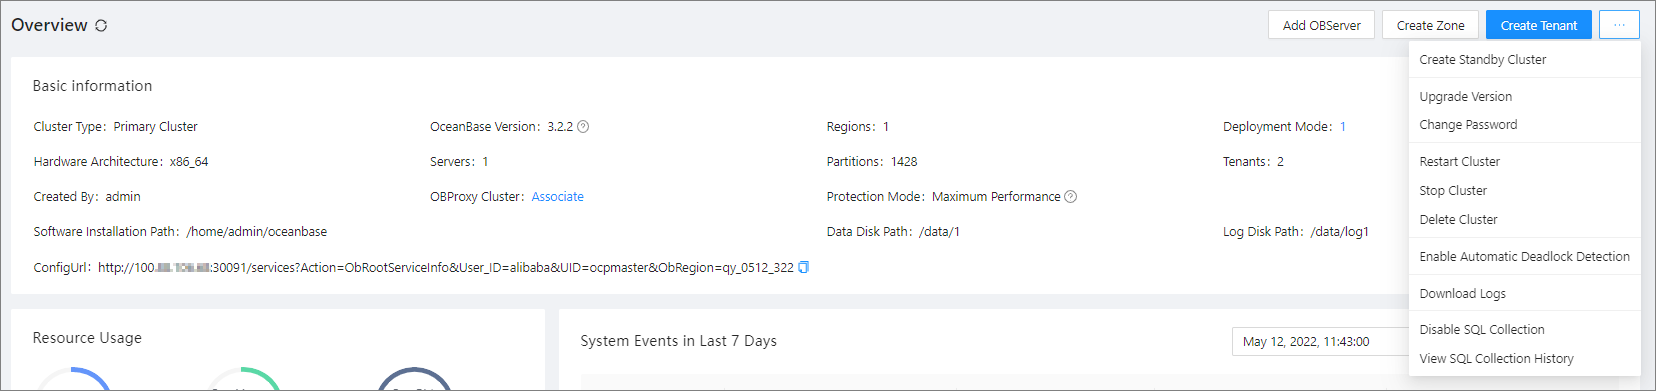
On the Overview page, you can view the basic information of the cluster in the following fields: Cluster Type, OceanBase Version, Regions, Deployment Mode, Hardware Architecture, Servers, Partitions, Tenants, Created By, OBProxy Cluster, Log Transfer Mode, Synchronization Status, Protection Mode, Software Installation Path, Data Disk Path, Log Disk Path , and ConfigUrl .
Parameter |
Description |
|---|---|
| Cluster Type | Valid values: Primary and Standby . |
| OceanBase Version | The OceanBase Database version of the cluster. |
| Regions | The number of regions in the cluster. |
| Deployment Mode | The deployment mode of the cluster. The value 1 indicates that the cluster has one zone and the zone has one host. The value 1-1 indicates that the cluster has two zones and each zone has one host. The value N-N-...N (M Ns) indicates that the cluster has M zones and each zone has N hosts. |
| Hardware Architecture | The hardware architecture of the host, which is automatically identified by OceanBase Cloud Platform (OCP) when the host is added. At present, the primary and standby clusters must use the same hardware architecture. |
| Servers | The number of hosts in the cluster. |
| Partitions | The number of partitions for the tables in the cluster. |
| Tenants | The number of tenants in the cluster. |
| Created By | The username of the user who created the cluster. |
| OBProxy Cluster | The OBProxy cluster associated with the current OceanBase cluster.
|
| Protection Mode | This parameter is displayed only for the primary cluster. For more information, see Protection mode. |
| Software Installation Path | The path was specified when the cluster was created. |
| Data Disk Path | The path was specified when the cluster was created. |
| Log Disk Path | The path was specified when the cluster was created. |
| Log Transfer Mode | This parameter is displayed for a standby cluster. The log transfer mode can be synchronous or asynchronous. When the log transfer mode is synchronous, the synchronization status can be asynchronous, depending on the protection mode. |
| Synchronization Status | The latency of log transfer. This parameter is displayed for a standby cluster. |
| ConfigUrl | The cluster URL. You can click the copy icon to copy it. |
View resource usage
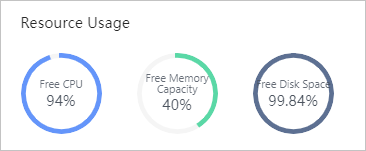
The Resource Usage section displays Free CPU, Free Memory Capacity , and Free Disk Space . You can manage the cluster based on the resource usage.
View alerts
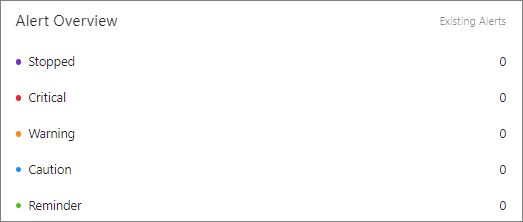
In the Alert Overview section, you can view the alerts of the current cluster, including alerts of the Stopped, Critical, Warning, Notice, and Reminder levels.
View system events in the last 7 days
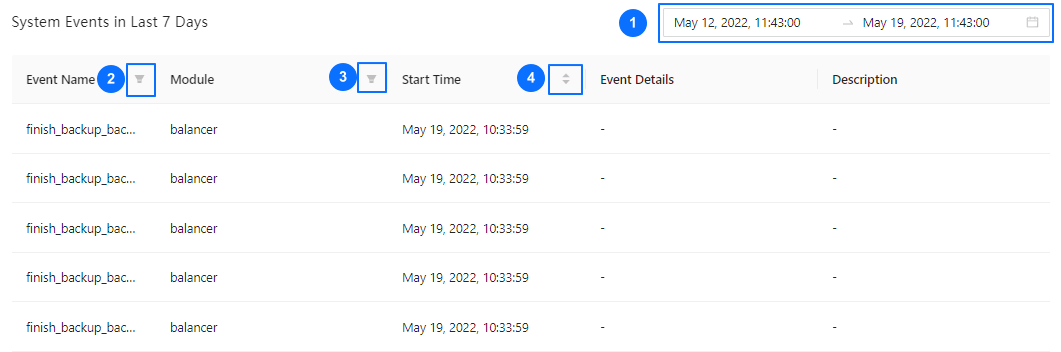
In the System Events in Last 7 Days section, you can specify search criteria to view the system events generated in the last 7 days, and perform the following operations:
Filter events by specifying the time range in the time selection field.
Filter events in the Event Name column.
Filter events in the Module column.
Sort the events in ascending or descending order by the start time in the Start Time column.
The system can combine the filter conditions and list the system events you want to view.
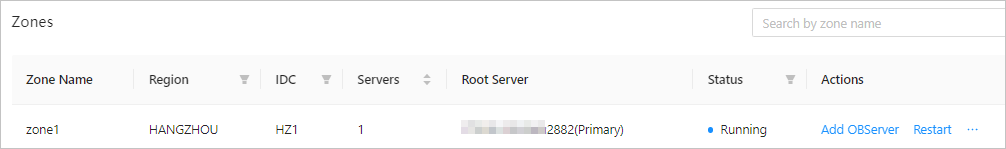
View zones
In the Zones section, you can search for zones. The table contains the following columns: Zone Name, Region, IDC, Servers, Root Server, Status , and Actions . The Actions column provides the following options: Add OBServer, Restart, Stop , and Delete . For more information, see Add an OBServer, Restart a zone, Stop a zone, and Delete a zone.
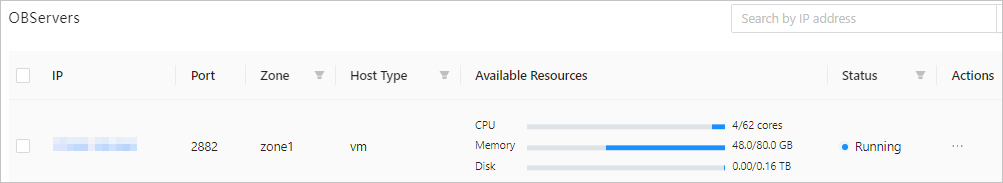
View OBServers
You can view OBServer information in the OBServers list in the following columns: IP, Port, IDC, Zone, Host Type, Available Resources, Status , and Actions . The Actions column provides the following options: Restart, Stop Service, Stop Process, Replace, Delete , and Download Logs . For more information, see Restart an OBServer, Stop an OBServer, Replace an OBServer, Delete an OBServer, and Download logs.
Manage clusters
On the Cluster Overview page, you perform basic management operations on the cluster. For more information, see Add an OBServer, Add a zone, Create a tenant, Create a standby cluster, Upgrade the version of an OceanBase cluster, Change the password of the SYS tenant, Restart a cluster, Stop a cluster, Delete a cluster, Decouple the primary and standby databases,Decouple a standby cluster from the primary cluster, Enable automatic detection of deadlocks, Disable automatic detection of deadlocks, Download logs, Disable SQL collection, and View the SQL collection history.
In the left-side navigation pane, you can also find the routine cluster maintenance features. For more information, see View the cluster topology, Manage tenants, Performance monitoring, Performance report, Cluster resource management, Health inspection, Major compaction details, Cluster backup and recovery, and View parameters.
Protection mode
Maximum performance: It protects user data and maximizes the performance of the primary cluster. In this mode, the log transfer between the primary cluster and all standby clusters is asynchronous.
Maximum availability: Normally, the primary cluster keeps synchronous log transfer with only one standby cluster.
Maximum protection: The primary cluster keeps synchronous log transfer with only one standby cluster, and asynchronous log transfer with other standby clusters.
Switch between clusters
To view the general information of another cluster, click the cluster name field in the upper left corner on the Overview page, and select the target cluster from the drop-down list.
