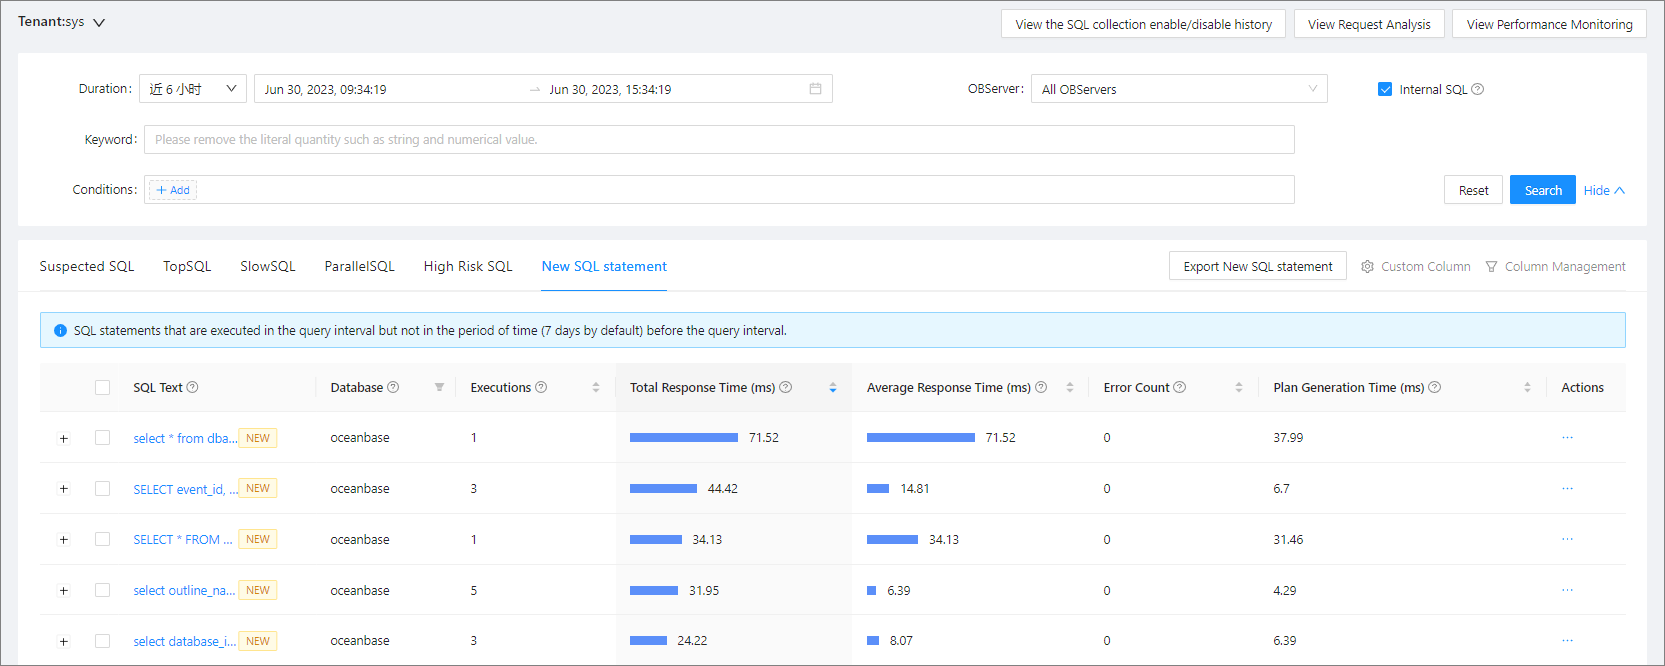
New SQL statements are those that have not been executed for a period of time (seven days by default) before the query period but were executed within the query period. This topic describes how to view diagnostics of new SQL statements.
Applicability
This topic applies only to OceanBase Cloud Platform (OCP) Enterprise Edition. OCP Community Edition does not support this feature.
Prerequisites
Make sure that you have the following permissions:
- Resource Permissions: Cluster Read-only or Tenant Read-only permission
- Menu Permissions: Permission on the Real-time Diagnostics menu of OceanBase Autonomy Service
You have enabled parameters in the SQL Diagnostics Collection section by referring to Manage parameters.
Procedure
Log on to the OCP console.
In the left-side navigation pane, click OceanBase Autonomy Service.
In the Cluster Details section, click the name of the cluster that you want to view.
The SQL Diagnostics tab of the Real-time Diagnostics page automatically appears.
Click the New SQL tab.
Specify the filter conditions.
Time Range: You can select Last 5 Minutes, Last 10 Minutes, Last 20 Minutes, Last 30 Minutes, Last 1 Hour, Last 3 Hours, or Last 6 Hours from the Time Range drop-down list. You can also select Custom Time from the drop-down list and specify the start time and end time as needed. By default, the information of the last 6 hours is displayed.
OBServer: You can select an OBServer node or all OBServer nodes in the list. If you select an OBServer node, only SQL statements executed on the selected OBServer node are queried.
Internal SQL: If you select this option, the SQL statements internally initiated in OceanBase Database are displayed in the query result.
Keyword: The SQL statements that contain the specified keyword are displayed in the query result. The keywords filter SQL statements in the same way as the SQL LIKE operator. The entered strings are automatically prefixed and suffixed with a percent sign (%).
Advanced Search: You can add multiple filter conditions in Advanced Search. Click Add. In the Add Advanced Conditions dialog box, you can specify a metric, an operator, and a metric value. The SQL statements that match the specified conditions will be displayed in the query result.
Click Search to list all SQL statements that meet the search criteria. You can perform the following operations:
Click Column Management. In the dialog box that appears, select the columns to display. Then, you can view the selected columns in the new SQL statement list.
On the New SQL tab, you can view the columns selected. You can copy the SQL text and filter the SQL statements by database.
You can click the SQL text of an SQL statement to go to the SQL Details page of the statement, where you can view the following details of the SQL statement:
In the SQL Text section, you can view the complete SQL statement.
In the Optimization Suggestions section, you can view the optimization suggestions for the SQL statement. For more information, see the View optimization suggestions section in View details of an SQL statement.
On the Previous Tendency tab, you can view the historical trends and plan generation time of the SQL statement. For more information, see the View the historical trends of an SQL statement section in View details of an SQL statement.
On the Execution Plans tab, you can view the execution plans of the SQL statement, or bind an execution plan to the statement. For more information, see the View the execution plans of an SQL statement section in View details of an SQL statement.
On the Index tab, you can view the indexes bound to the SQL statement. For more information, see the View and bind indexes section in View details of an SQL statement.
On the SQL Throttling tab, you can view or set throttling of the SQL statement. For more information, see the Set throttling for an SQL statement section in View details of an SQL statement.


