







This topic describes how to view SQL details in OCP, including the SQL execution status, execution plan, bound indexes, and whether the SQL is throttled.
You can view SQL diagnostics in the following ways:
Method 1: Log in to OCP and click OceanBase Autonomy Service in the left-side navigation pane. Click the name of the cluster to go to the Real-time Diagnostics page of the cluster.
Method 2: Log in to OCP. On the Overview page of your tenant, click SQL Diagnostics in the left-side navigation pane.
Applicability
SQL diagnostics is not supported in the Community Edition. You can only use Method 2 to view SQL diagnostics.
Prerequisites
When you view SQL details through Access Point 1, make sure that the logged-in user in OCP has the following permissions:
- Cluster Read-Only or Tenant Read-Only resource permissions.
- Permissions on the Real-time Diagnostics menu of the Autonomous Service.
When you view SQL details through Access Point 2, make sure that the logged-in user in OCP has the following permissions:
- Cluster Read-Only or Tenant Read-Only resource permissions.
- Permissions on the SQL Diagnostics menu of the tenant.
OceanBase Database V3.0 and later versions support viewing SQL execution profiles.
For tenants of the MySQL mode, the password of the tenant is stored in the password box of the OCP user.
For tenants of the Oracle mode, the password of the SYS tenant is stored in the password box of the OCP user.
Note
For the logged-in tenant to be able to bind indexes, bind execution plans, and set throttling, it must have the UPDATE permission on the tenant.
Go to the SQL details page
The following steps are given as an example for Method 1.
In the left-side navigation pane, click OceanBase Autonomy Service. On the Cluster Details page, click the name of the target cluster to go to the Real-time Diagnostics page of the cluster.
The system displays the SQL Diagnostics tab by default.
On the Suspicious SQL, TopSQL, SlowSQL, ParallelSQL, High Risk SQL, and New SQL statement tabs, find the target SQL.
You can set search conditions to locate the target SQL.

Click the SQL statement of the target SQL to go to the details page of the SQL.
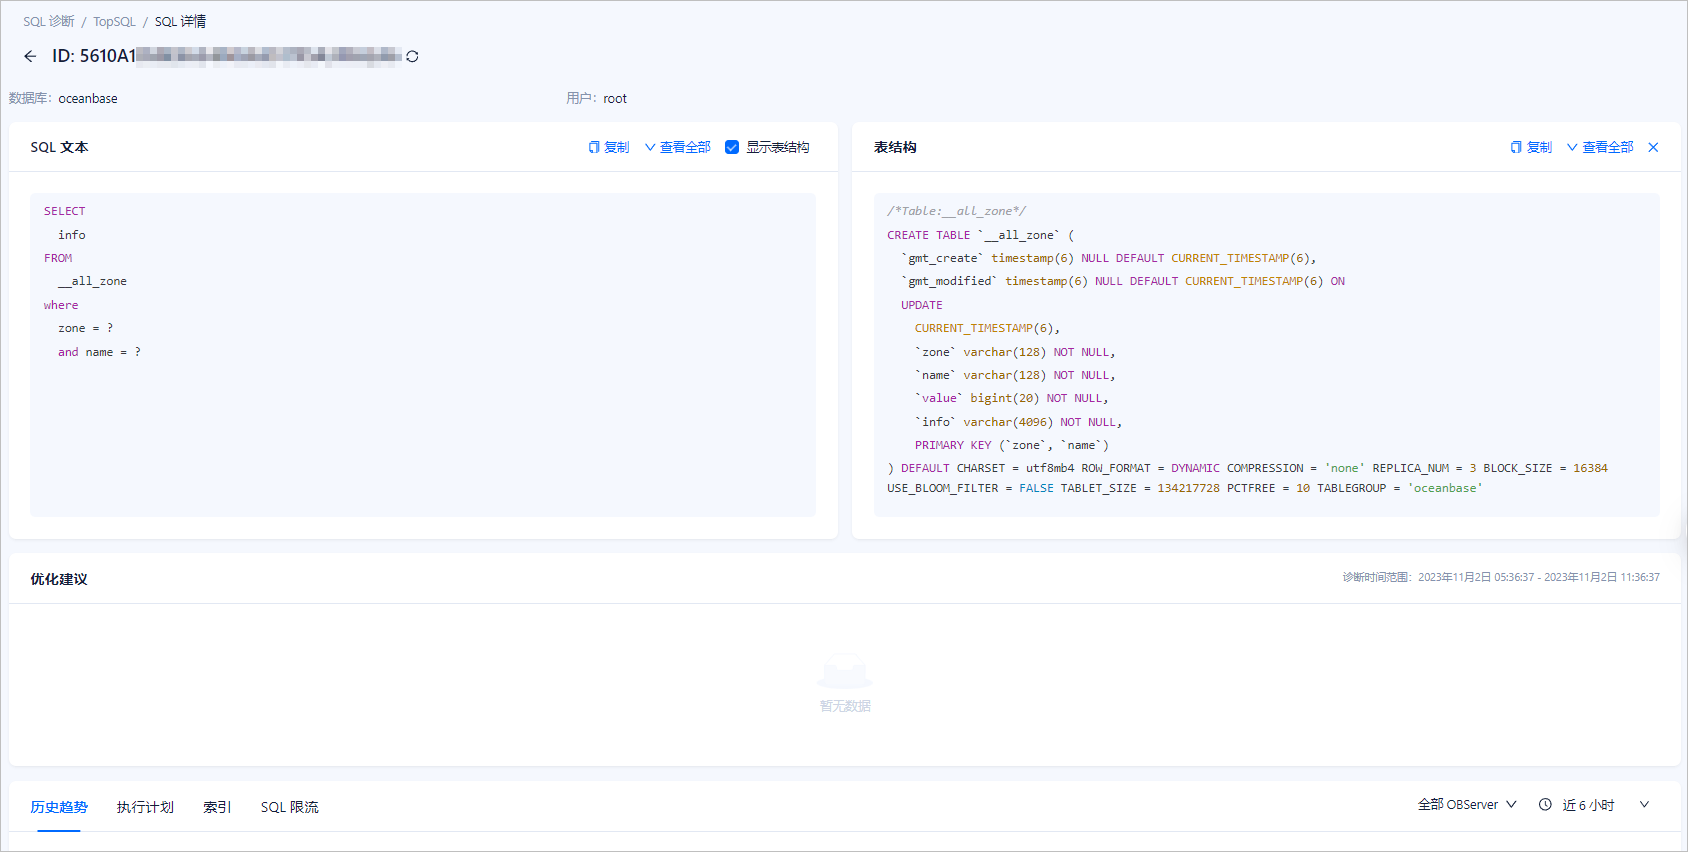
On the SQL Details page, you can view the following details about the SQL:
In the SQL Text section, view the complete SQL statement. OCP will desensitize the SQL statement before displaying it. If the SQL statement fails to be parsed, the original SQL statement will be displayed. If you enable the option to show table schema, the statement for creating the table will be displayed.
In the Optimization Suggestions section, view the optimization suggestions for the SQL statement. For more information, see View optimization suggestions.
In the SQL Execution Profile section, view the execution details of the SQL statement. For more information, see View SQL execution profile.
On the Previous Tendency tab, view the historical trends of the SQL statement. For more information, see View historical trends of the SQL statement.
On the Execution Plans tab, view the execution plan of the SQL statement or bind an execution plan to it. For more information, see View execution plan.
On the Index tab, view the indexes bound to the SQL statement. For more information, see View and bind indexes.
On the SQL Throttling tab, view the throttling status of the SQL statement or set throttling for it. For more information, see Set SQL throttling.
On the Execution Plans, Index, and SQL Throttling tabs, you can click View Binding Records in Last 30 Days to view the binding records of the SQL statement.
In the binding records, you can view the status of the bound plan. You can click Unbind to unbind the SQL statement from the plan or click Bind Plan to bind them again.
View optimization suggestions
When the SQL execution plan changes and the performance decreases, the system provides a plan binding suggestion. When the SQL index is not optimal and meets the following conditions, the system provides an index optimization suggestion:
- The average response time of the SQL query is greater than 20 ms, or the average CPU time is greater than 10 ms.
- The SQL query type is one of the following: SELECT, SELECT_FOR_UPDATE, UPDATE, or DELETE.
- The SQL query does not contain the difficult predicate "OR".
- The SQL query does not contain JOIN.
You can view the diagnostic issues and suggested solutions for this SQL query in the Optimization Suggestions section, and perform operations such as viewing Plan Hash, binding execution plans, and viewing diagnostic details.
When recommending indexes, the system follows the following algorithm:
Equi-join columns are placed at the beginning, and can be combined in any order.
For range joins, the most selective range join columns are placed after the equi-join columns.
For SQL queries without range joins, if the elimination sort condition is met, the sorted columns are placed after the equi-join columns.
Columns in other predicates are placed after the index, at which point the index is a half-width index.
Columns in other predicates of the SQL query are placed after the index, and a covering index is constructed.
If the SQL query contains at most eight columns, a covering index is recommended; otherwise, a half-width index is recommended.
Note
Table join scenarios are currently not supported.
The following parameters are configured:
ocp.perf.sql.index-advisor-cpu-time-threshold: the average CPU time threshold for recommending indexes. If the average CPU time of an SQL query is greater than the value of this parameter, an index is recommended for the SQL query.ocp.perf.sql.index-advisor-elapsed-time-threshold: the average response time threshold for recommending indexes. If the average response time of an SQL query is greater than the value of this parameter, an index is recommended for the SQL query.
When recommending historical plans, the system analyzes the execution plans of the SQL query in the last seven days. If the average CPU time of a plan is less than 80% of that of the most recent plan of the same type, the plan is recommended. Local plans are prioritized. If no local plans are available, distributed plans are recommended.
Note
Only suspicious SQL queries support viewing diagnostic details.
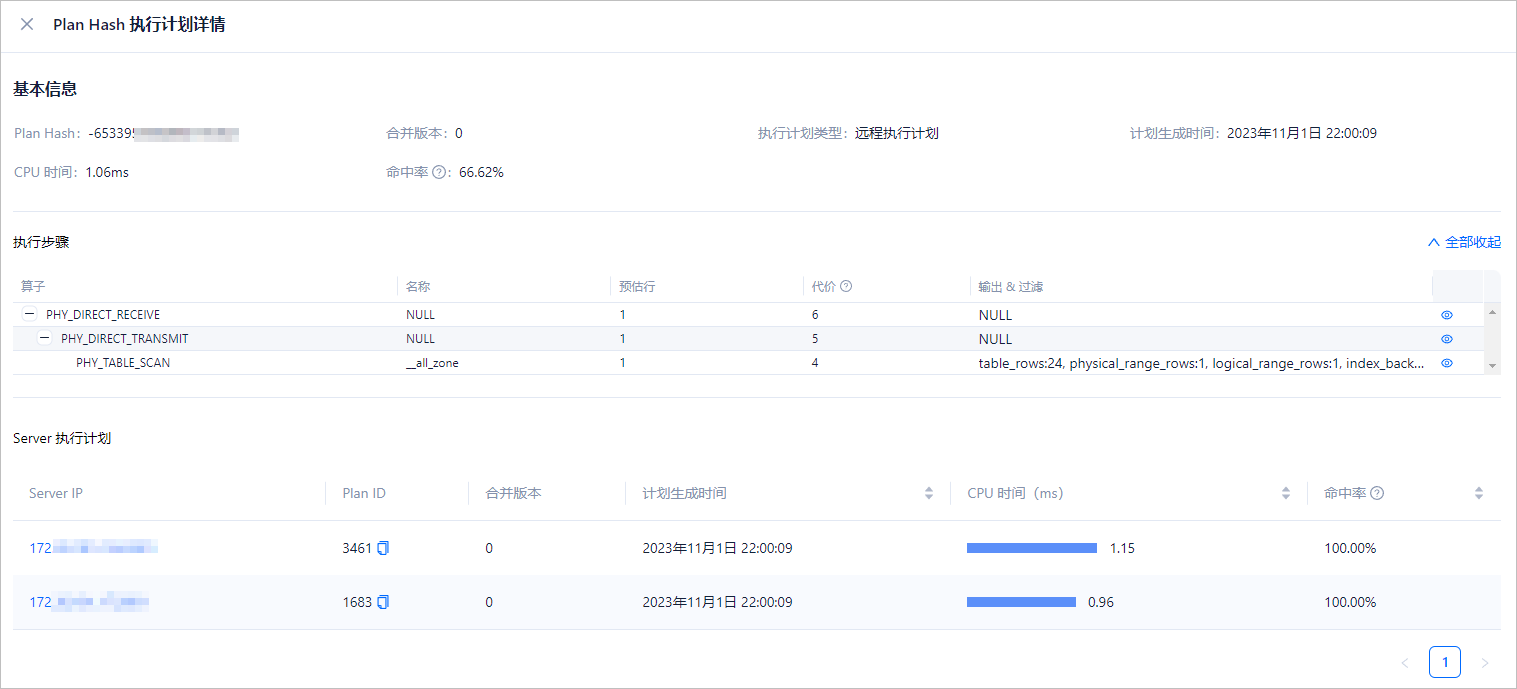
View Plan Hash
Click the View Plan Hash button to view the execution plan details in the Plan Hash view, including basic information, execution steps, and server execution plan.
Bind an execution plan
Click the Bind Execution Plan button. In the dialog box that appears, click Bind. After the binding is successful, refresh the page. You can click View Binding Records in Last 30 Days to view that the execution plan has been bound.

View diagnostic details
Click the View Diagnostic Details button to view the diagnostic details of the suspicious SQL query.
View SQL execution profile
On the SQL Execution Profile page, you can view the operator-level SQL execution details within the collection time range, including TraceID, degree of parallelism, request time, response time, and actions.
Note
Only ParalleSQL supports viewing SQL execution profiles.
View trace details
Click the TraceID to go to the Trace Details page, where you can view the execution profile, including trace basic information, schema tables, schema indexes, OBServer details, and operator execution details.
Click Download Execution Profile Report in the upper-right corner of the page to export the trace information as an HTML file to your local device.
Click the triangle icon next to the Trace ID to switch traces.
On the Schema Table tab, click the statement to view the details.
On the Schema Index tab, you can bind and unbind indexes.

Download an execution profile report
In the SQL Execution Profile table on the Actions column, click Download Execution Profile Report to export the trace information as an HTML file to your local device.

View the execution trend of an SQL statement
On the SQL Details page, click the Previous Tendency tab.
You can view the charts about the SQL execution trend and the plan generation time. If you change the statistics time in the charts, the SQL running chart and SQL plan generation time chart are updated according to the selected time period.
SQL execution trend
By default, the running trend chart displays the Average Response Time, CPU Time, and Execution Time metrics. You can use Metric Management to select the metrics that you want to display.

SQL plan generation time
The Plan Hash column indicates that a new plan is generated. The vertical axis shows the time consumed in generating the plan.

View the execution plan of an SQL statement
On the SQL Details page, click the Execution Plans tab. You can do the following operations on this tab:
Use Custom Time to specify the query time range and window duration.
Click View Binding Records in Last 30 Days to view the execution plans from the last 30 days.
Click on the value of the Plan Hash column to view the detailed execution information of this execution plan, including the basic information, execution steps, and execution status on each OBServer node.
Click Bind to bind this execution plan with the current SQL statement.

View and bind indexes
On the SQL Details page, click the Index tab, and you can:

View the index binding status of the SQL statement in the table.
You can filter indexes by index status and type. You can also click Bind to bind the SQL statement to an index. You can create an index in a console or connect to OceanBase Developer Center (ODC) to create an index.
Click View Binding Records in Last 30 Days to view the index binding records of the SQL statement in the last 30 days.
In the binding records, you can view the status of the bound index. You can click Unbind to unbind the SQL statement from the index, or click Bind Plan to bind them again.

Set SQL throttling
On the SQL Details page, click the SQL Throttling tab, and you can:
Check whether the current SQL statement is throttled.
As shown in the following figure, the SQL statement is not throttled.

Set throttling for the current SQL statement.

As shown in the following figure, turn on the throttling switch and configure the throttling strategy:
Maximum Concurrent Requests: the maximum value is +∞. Set the value to 0 to disable throttling.
Throttling Keyword: click Settings , and enter a throttling keyword in the ? field, which is marked as ① in the following figure.
Note
If no throttling keyword is specified, throttling is performed on the entire SQL statement.
As shown at ② in the following figure, view the reason why the throttling keyword setting failed.

Click Update , and then click OK.