This topic describes how to view comparison of Top SQL statements.
Prerequisites
Make sure that you have the following permissions:
- Resource Permissions: Cluster Read-only or Tenant Read-only permission
- Menu Permissions: Permission on the Real-time Diagnostics menu of OceanBase Autonomy Service
Procedure
Log on to the OceanBase Cloud Platform (OCP) console.
In the left-side navigation pane, click Autonomous service.
In the Cluster Details section, click the name of the target cluster.
By default, the SQL Diagnostics tab of the Real-time Diagnostics page appears.
In the list on the TopSQL tab, click Comparison of Top SQL Statements and choose Comparison by Period or Comparison on Different Nodes in the panel that appears to compare and analyze the top SQL statements in different dimensions.
View the comparison details of top SQL statements in different time periods
On the Comparison by Period tab, the system displays the SQL statements that meet the following rules within the specified Period for Comparison in comparison against the specified Baseline Period:
- The SQL statement is ranked top N for the first time. The value of N is specified by the
perf.sql.top-sql-comparison.new-in-top-n-limitparameter in OCP. The default value of the parameter is100. - An increase in the number of executions of the SQL statement exceeds the specified threshold. The threshold is specified by the
perf.sql.top-sql-comparison.executions-increase-limitparameter in OCP. The default value of the parameter is20%. - An increase in the average response time for the SQL statement exceeds the specified threshold. The threshold is specified by the
perf.sql.top-sql-comparison.elapsed-time-increase-limitparameter in OCP. The default value of the parameter is20%. - An increase in the average number of returned rows for the SQL statement exceeds the specified threshold. The threshold is specified by the
perf.sql.top-sql-comparison.return-rows-increase-limitparameter in OCP. The default value of the parameter is20%. - An increase in the error rate of the SQL statement exceeds the specified threshold. The threshold is specified by the
perf.sql.top-sql-comparison.error-percentage-increase-limitparameter in OCP. The default value of the parameter is10%. - An increase in the percentage of remote plans for the SQL statement exceeds the specified threshold. The threshold is specified by the
perf.sql.top-sql-comparison.remote-plan-percentage-increase-limitparameter in OCP. The default value of the parameter is20%. - An increase in the number of executions of the SQL statement exceeds the specified threshold. The threshold is specified by the
perf.sql.top-sql-comparison.executions-increase-limitparameter in OCP. The default value of the parameter is10%.
Procedure:
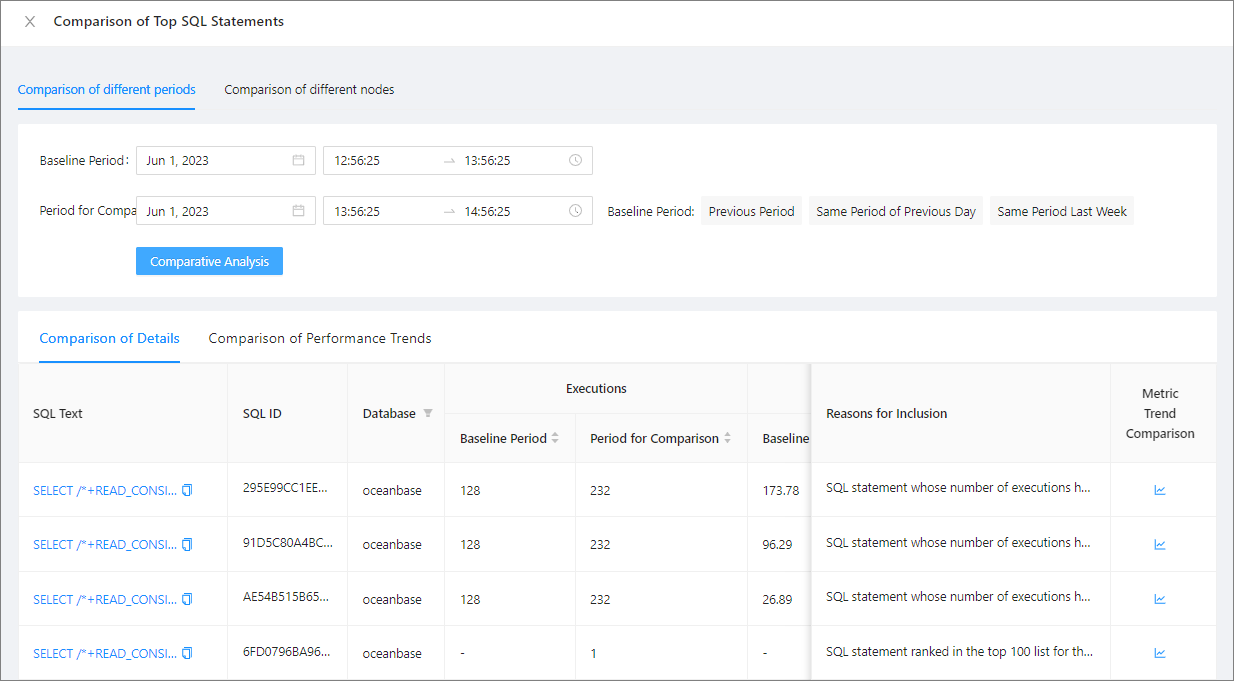
Specify Baseline Period and Period for Comparison.
- Select a period of time for Baseline Period.
- Set Comparison Period to Previous Period, Same Period of Previous Day, Same Period Last Week, or a custom period.
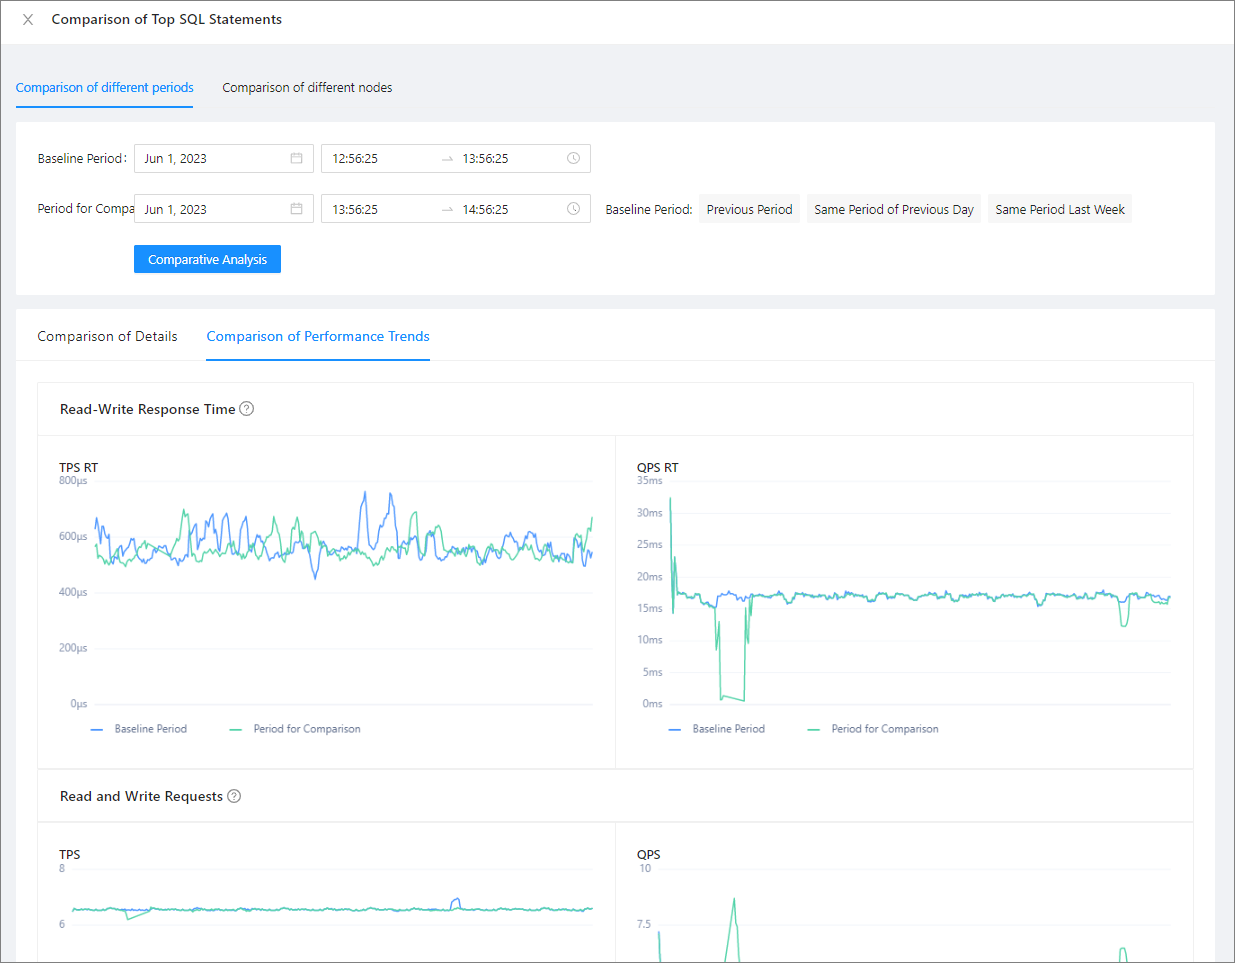
Click Comparative Analysis and view the details on the Comparison of Details and Comparison of Performance Trends tabs.
Comparison of Details: On this tab, you can view details about SQL statements.
You can click the SQL text of an SQL statement to view its details and click the trend chart icon on the right to view the metric trend comparison chart.

Comparison of Performance Trends: On this tab, you can view the performance trend comparison charts of SQL statements, including the read/write response time, number of read/write requests, and CPU utilization.

- The SQL statement is ranked top N for the first time. The value of N is specified by the
View the comparison details of top SQL statements on different nodes
You can compare the execution performance of the same SQL statement on different nodes.
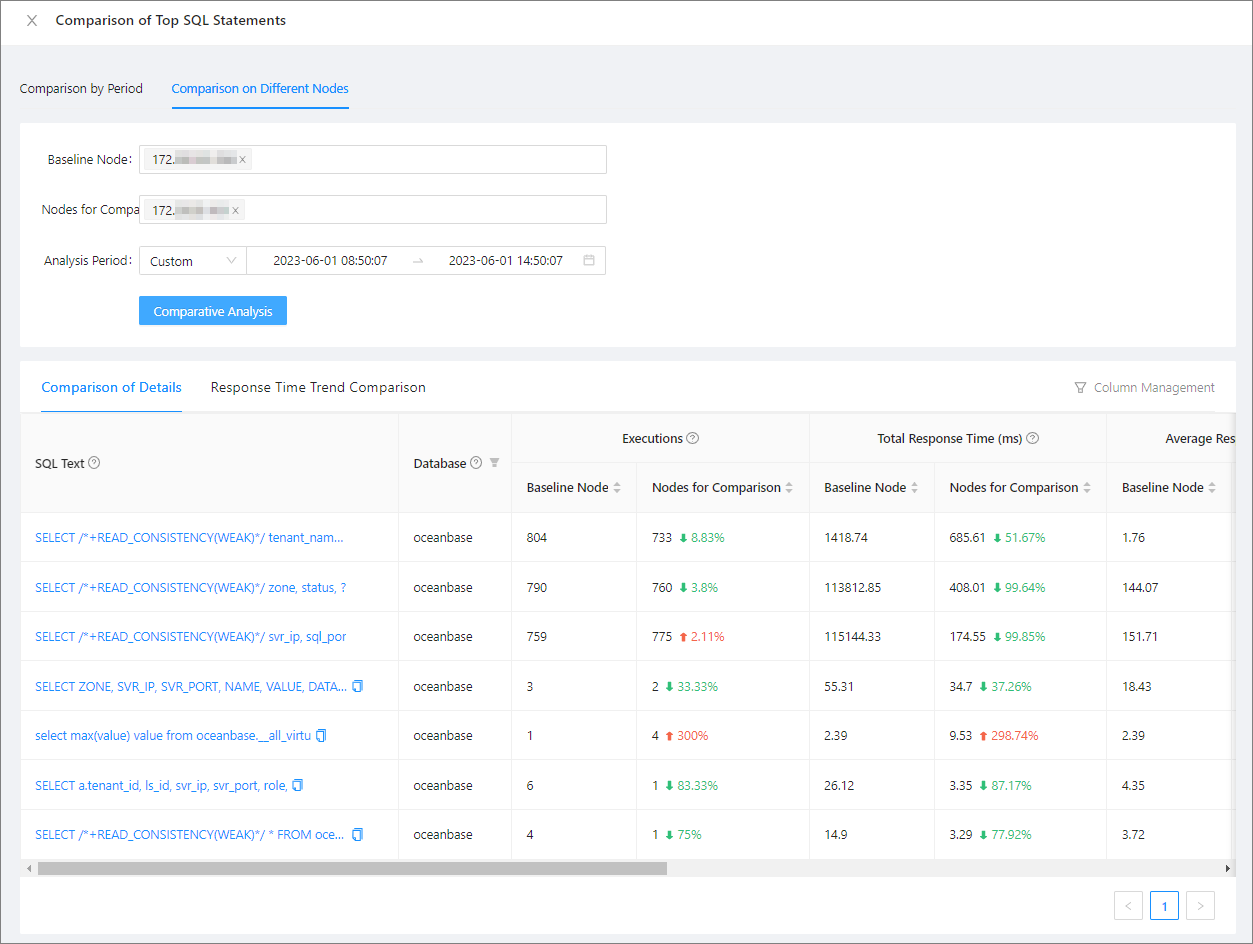
Select the baseline node and the node for comparison.
Select an analysis period.
You can view the comparison details of the last five minutes, last half hour, last hour, last six hours, or a custom time range.
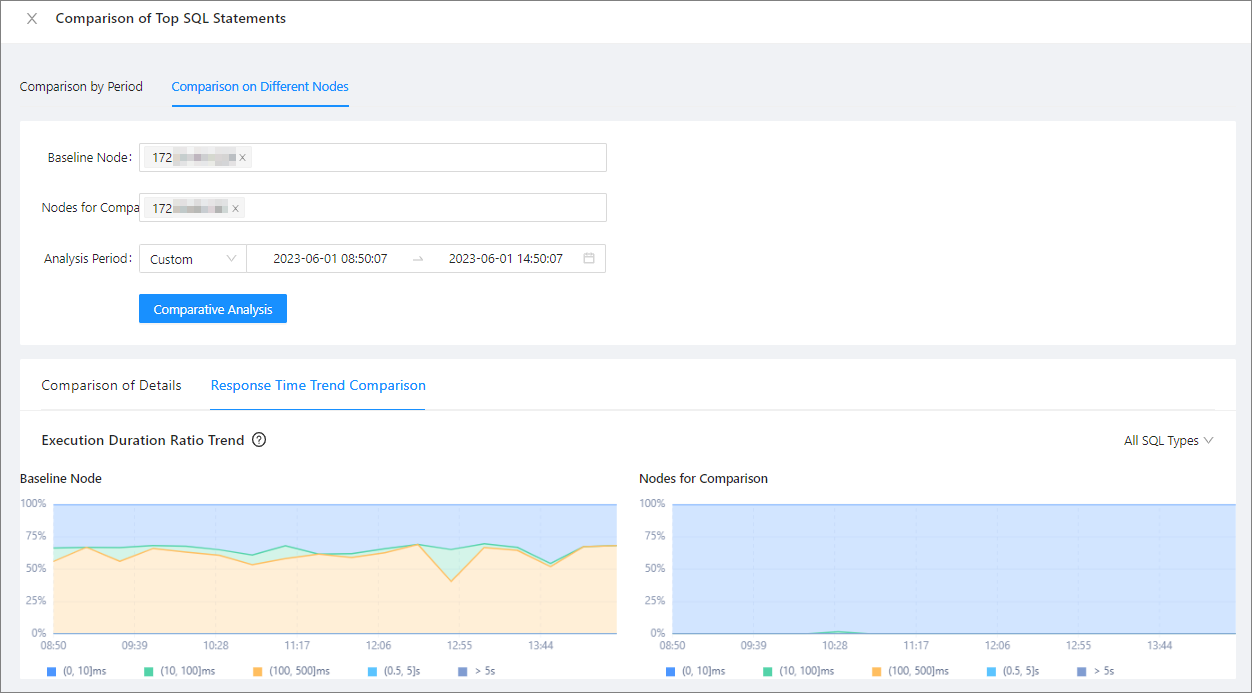
Click Comparative Analysis to view the data comparison details and response time trend details.
Comparison of Details: On this tab, you can view details about SQL statements.
You can click the SQL text of an SQL statement to view its details and click Column Management in the upper-right corner to configure the column expression and column name of a custom column in the dialog box that appears.

Response Time Trend Comparison: This tab shows the execution duration ratio trends of the baseline node and the node for comparison.
Click All SQL Types in the upper-right corner to select the type of SQL statements that you want to view.


