The TopSQL tab displays the SQL statements in descending order of the total response time in a tenant. On the Tenant Overview page, you can filter top SQL statements by time range and OBServer node and view the details of each top SQL statement in the list.
You can diagnose top SQL statements by using the following methods:
Method 1: Log in to the OceanBase Cloud Platform (OCP) console. In the left-side navigation pane, click OceanBase Autonomy Service. On the page that appears, find the target cluster and click its name to go to the Real-time Diagnostics page.
Note
When you view top SQL statements by using OceanBase Autonomy Service, the TopSQL feature allows you to perform real-time diagnostics on top SQL statements of a specific tenant or all tenants in a cluster. If you find that the CPU load of a host is unusually high, you can use this feature to identify the SQL statements that take the most time to execute on the host and optimize them.
Method 2: Log in to the OCP console. On the Overview page of a tenant, click SQL Diagnostics in the left-side navigation pane.
Applicability
OCP Community Edition does not support OceanBase Autonomy Service. To use this service, go to the relevant page by using Method 2.
Prerequisites
To diagnose top SQL statements by using Method 1, make sure that you have the following permissions:
- Resource Permissions: Cluster Read-only or Tenant Read-only permission
- Menu Permissions: Permission on the Real-time Diagnostics menu of OceanBase Autonomy Service
To diagnose top SQL statements by using Method 2, make sure that you have the following permissions:
- Resource Permissions: Cluster Read-only or Tenant Read-only permission
- Menu Permissions: Permission on the SQL Diagnostics menu of Tenants
You have enabled parameters in the SQL Diagnostics Collection section by referring to Manage parameters.
Procedure
The procedure of Method 1 is described as follows:
Log in to the OCP console. In the left-side navigation pane, click OceanBase Autonomy Service. On the Cluster Details page, click the name of the target cluster to go to its Real-time Diagnostics page.
By default, the SQL Diagnostics tab appears.
The SQL diagnostic data is not displayed on the SQL Diagnostics tab if you do not set the values of both the cluster parameter
enable_sql_auditand the tenant parameterob_enable_sql_audittoTrue. You can click Change Cluster Parameters in the prompt to modify the parameter values.Click the TopSQL tab.
Filter the top SQL statements.
1 Specify the filter conditions.
Time Range: You can select Last 5 Minutes, Last 10 Minutes, Last 20 Minutes, Last 30 Minutes, Last 1 Hour, Last 3 Hours, or Last 6 Hours from the Time Range drop-down list. You can also select Custom Time from the drop-down list and specify the start time and end time as needed. By default, the information of the last 6 hours is displayed.
OBServer: You can select one OBServer node or all OBServer nodes in the list. If you select one OBServer node, only SQL statements executed on the selected OBServer node are queried.
Internal SQL: If you select this option, the SQL statements internally initiated in OceanBase Database are displayed in the query result.
Keyword: If you specify a keyword, the SQL statements that contain the keyword are displayed in the query result.
Advanced Search: You can add multiple filter conditions in Advanced Search. Click Add. In the Add Advanced Conditions dialog box, you can specify a metric, an operator, and a metric value. The SQL statements that match the specified conditions are displayed in the query result.
Quick Filter: You can select an option, such as Full Table Scan or Multi-Partition Scan, to quickly identify SQL statements that need to be optimized.

- Click Search to list all SQL statements that meet the filter conditions.
You can copy the SQL text and filter the SQL statements by database. You can also sort the SQL statements by the number of executions, total response time, average response time, error count, and plan generation time, and view the diagnostic results.

Click Comparison of Top SQL Statements. In the panel that appears, you can select Comparison by Period or Comparison on Different Nodes to compare and analyze the top SQL statements in different dimensions. For more information, see View comparison of top SQL statements.
Click Export TopSQL to export all SQL statements in the query result.
View information about top SQL statements.
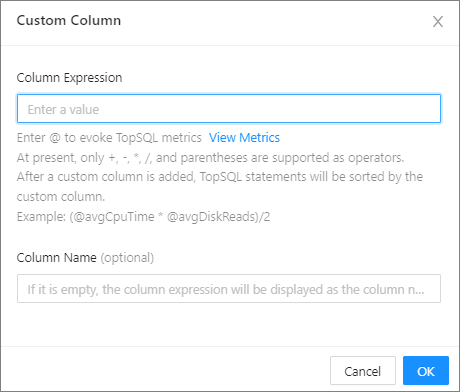
- Click Custom Column. In the dialog box that appears, specify the expression and name for the custom column. Then, you can view the column in the top SQL statement list.
Note
- The supported operators are the plus sign (+), minus sign (-), asterisk (*), forward slash (/), and parentheses.
- After a custom column is added, the SQL statements on the TopSQL tab are automatically sorted by the custom column.
- Only one custom expression is supported. If a custom column already exists when you create a custom column, the new custom column overwrites the original one.
- The attribute name of a custom column must start with an at sign (@) or a dollar sign ($).

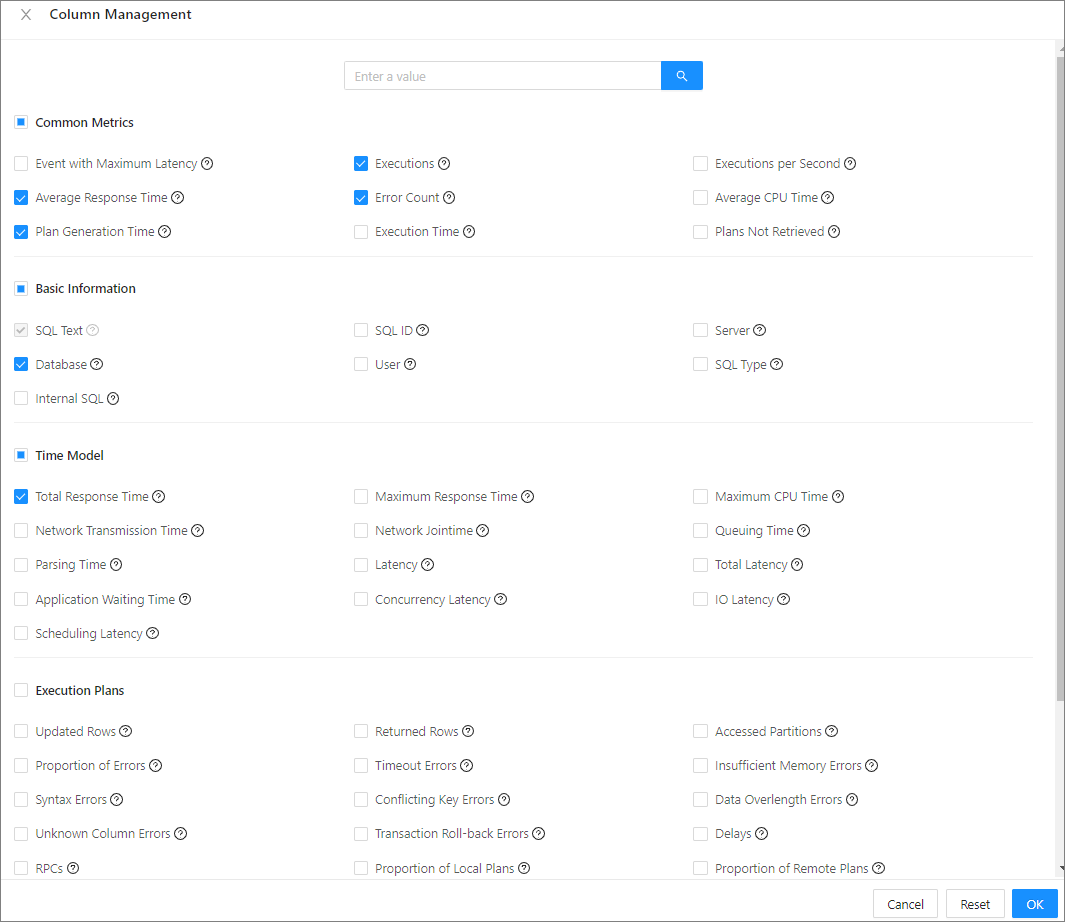
Click Column Management. In the dialog box that appears, select the columns to display. Then, you can view the selected columns in the top SQL statement list.

Click the + icon on the left side of the SQL text to view the specific error details of the SQL statement.

Click the SQL text of an SQL statement to go to the SQL Details page of the statement.
On the SQL Details page, you can view the following details of the SQL statement:
In the SQL Text section, you can view the complete SQL statement.
In the Optimization Suggestions section, you can view the optimization suggestions for the SQL statement. For more information, see the View optimization suggestions section in View the details of an SQL statement.
On the Previous Tendency tab, you can view the historical trends of the SQL statement. For more information, see the View the historical trends of an SQL statement section in View the details of an SQL statement.
On the Execution Plans tab, you can view the execution plans of the SQL statement, or bind an execution plan to the statement. For more information, see the View the execution plans of an SQL statement section in View the details of an SQL statement.
On the Index tab, you can view the indexes bound to the SQL statement. For more information, see the View and bind indexes section in View the details of an SQL statement.
On the SQL Throttling tab, you can view or set throttling for the SQL statement. For more information, see the Set throttling for the SQL statement section in View the details of an SQL statement.
You can view the binding records of the SQL statement in section ① as illustrated on the Execution Plans, Index, and SQL Throttling tabs.

In the binding records, you can view the status of a bound execution plan, or click Unbind to unbind the plan from the SQL statement. You can click Bind Plan to bind the plan to the SQL statement again.
Set throttling.
You can click Enable Throttling to enable throttling for the SQL statement. For more information, see the Set throttling for the SQL statement section in View the details of an SQL statement.
You can also select multiple SQL statements and click Batch Set Throttling. In the dialog box that appears, specify the maximum number of SQL statements that can be executed concurrently.
Note
Keyword-based throttling is not supported in batch throttling.

