OCP-Agent can push the monitoring data to Pushgateway, which can pull monitoring data collected by OCP-Agent.
OCP-Agent monitoring description
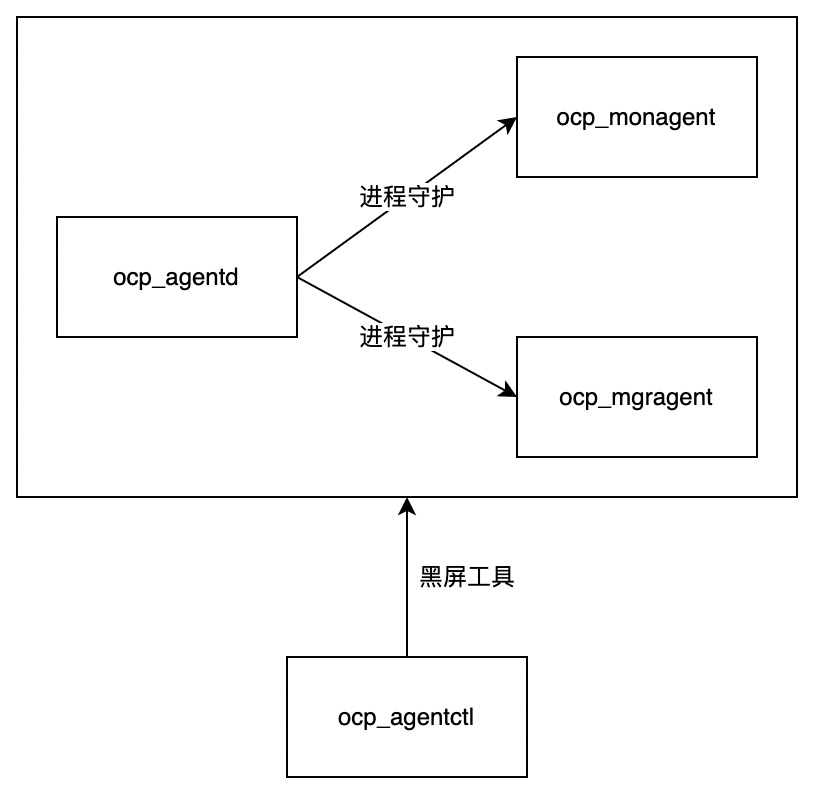
OCP-Agent is a management and monitoring component deployed on the host. It runs with three resident processes and one command-line tool (CLI) process.
The ocp_mgragent process is the management process that executes O&M commands for the OceanBase database and OBProxy.
The ocp_monagent process is the monitoring process that collects monitoring data from the OceanBase database, OBProxy, and host.
The ocp_agentd process is the daemon process of ocp_mgragent and ocp_monagent.
The ocp_agentctl process is the process of the O&M CLI tool.

OCP-Agent generates the following two types of time-series monitoring data in the formats defined in Prometheus:
Business monitoring data, such as the monitoring data of hosts, OceanBase database, clusters, and tenants.
OCP-Agent self-monitoring data related to the running status of OCP-Agent, such as the resource usage by OCP-Agent and the running status of the related processes.
Note
In addition to the time-series data, OCP-Agent also collects SQL audit data from OceanBase Database for the diagnostic analysis of SQL statements and alert triggering. Log data is collected for analyzing fault causes. Non-time-series data is not included in this topic.
Scheme for pulling time-series monitoring data
In OCP V3.2.0 and later, the monitoring APIs of OCP-Agent support authentication. The authentication uses random passwords that cannot be queried. In OCP V3.3.2, you can disable the authentication. After the authentication is disabled, OCP-Agent can directly pull the monitoring data.
The monitoring APIs are controlled by the ocp.agent.auth.metric-auth-enabled parameter. The default value is true, which indicates that the authentication is enabled. If you set the parameter to false, OCP-Agent can directly pull the monitoring data.
The following table describes the monitoring APIs:
| Exporter | Recommended collection interval | Description |
|---|---|---|
http://<ip>:62889/metrics/node/host |
1 to 15 seconds | The host monitoring data collected by the node_exporter process. |
http://<ip>:62889/metrics/node/ob |
1 to 15 seconds | The host-level monitoring data after OceanBase Database is deployed, such as the availability of OceanBase services and the status of OceanBase processes. |
http://<ip>:62889/metrics/ob/basic |
1 to 15 seconds | The monitoring data collected from system tables of OceanBase Database. |
http://<ip>:62889/metrics/node/obproxy |
1 to 15 seconds | The host-level monitoring data after OBProxy is deployed, such as the status of the obproxy process. |
http://<ip>:62889/metrics/obproxy |
1 to 15 seconds | The monitoring data of OBProxy collected from http://localhost:2884/metrics. |
http://<ip>:62889/metrics/ob/extra |
1 minute | The monitoring data collected from system tables of OceanBase Database. |
http://<ip>:62888/metrics/stat |
1 minute | The self-monitoring data of the ocp_mgragent process, mainly about the resource usage by the process. |
http://<ip>:62889/metrics/stat |
1 minute | The self-monitoring data of the ocp_monagent process, mainly about the resource usage by the process and the status of monitoring collection pipeline. |

