This topic describes how to create a chart. OceanBase Cloud Platform (OCP) allows you to create a chart to display the execution results of custom metrics.
You can create a chart by using the following three methods:
- Method 1: On the Custom Monitoring page, click Create Chart in the upper-right corner.
- Method 2: If no charts are created, go to the Custom Monitoring page, and click Create Chart on the Charts tab.
- Method 3: If you have created a metric, go to the Custom Monitoring page and click the Metrics tab, where you can create a chart for the metric.
Prerequisites
Make sure that you have the following permissions:
- Resource Permissions: Cluster Read-only, Tenant Read-only, OBProxy Read-only, Arbitration Service Read-only, Binlog Service Read-only, or Host Read-only permission
- Menu Permissions: Permission on the All menu of Performance Monitoring
Procedure
The following procedure demonstrates how to use Method 1.
Log on to the OCP console.
In the left-side navigation pane, choose Performance Monitoring.
Click Custom Monitoring in the upper-right corner.
On the Custom Monitoring page, click Create Chart in the upper-right corner.
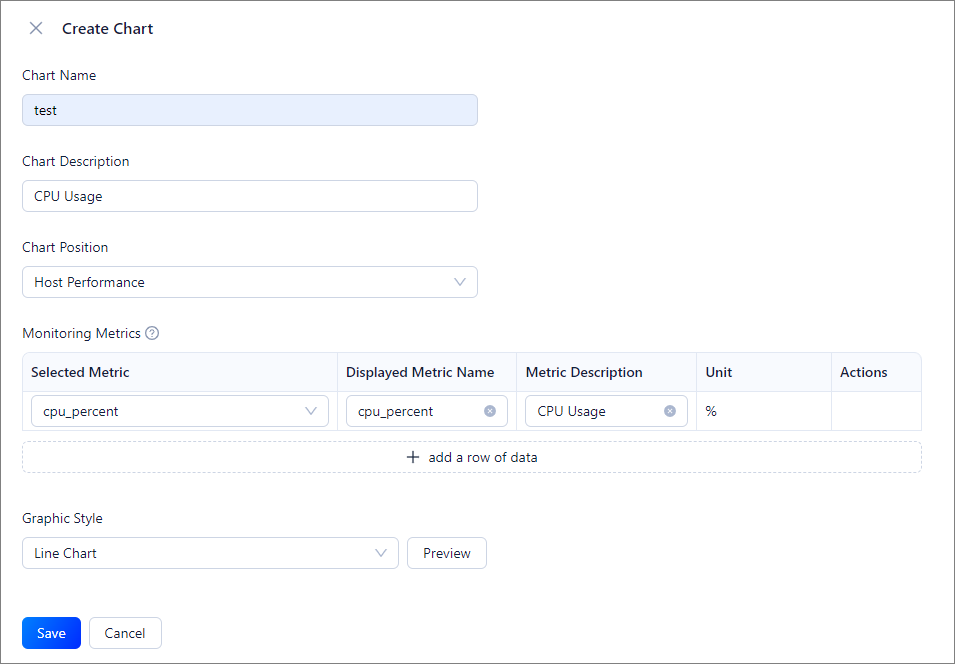
In the panel that appears on the right, set the parameters.
ParameterDescriptionChart Name The name of the chart. The name can contain uppercase and lowercase letters, digits, and underscores (_), and must be 2 to 48 characters in length. Chart Description The additional information about the chart. Chart Position The location where the chart is displayed. Valid values: - Clusters - Database Performance
- Clusters - Host Performance
- Clusters - OBServer Performance
- Tenants - Performance and SQL
- Tenants - Transactions
- Tenants - Storage and Cache
- OBProxy - System Monitoring
- Host Performance
- Host Resources
- Host Process
Note
When you create a chart for specific metrics, the chart location is automatically generated based on the metrics.
Monitoring Metrics - Selected Metric: Select a metric from the drop-down list. The selected metric is associated with the chart location. If the required metric does not exist in the drop-down list, you can click Add Metric at the bottom of the list to create a metric. For more information, see Create a metric.
In the Selected Metric drop-down list, you can select built-in and custom metrics of OCP. For more information about built-in metrics of OCP, see Overview. - Displayed Metric Name: the displayed name of the selected metric. This parameter is automatically filled based on the selected metric, and can be modified.
- Metric Description: the description of the selected metric. This parameter is automatically filled based on the selected metric, and can be modified.
- Unit: The unit of the selected metric. This parameter is automatically filled based on the selected metric, and can be modified.
Note
- To use multiple metrics in the chart, click add a row of data to add a metric. To remove a metric, click Delete in the Actions column.
- The system consumes server resources to query the monitoring data of a metric. If you use multiple metrics in a chart and server resources are insufficient, data queries are slow. We recommend that you add metrics based on the actual server resources.
Graphic Style The style of the chart. Only line charts are supported.