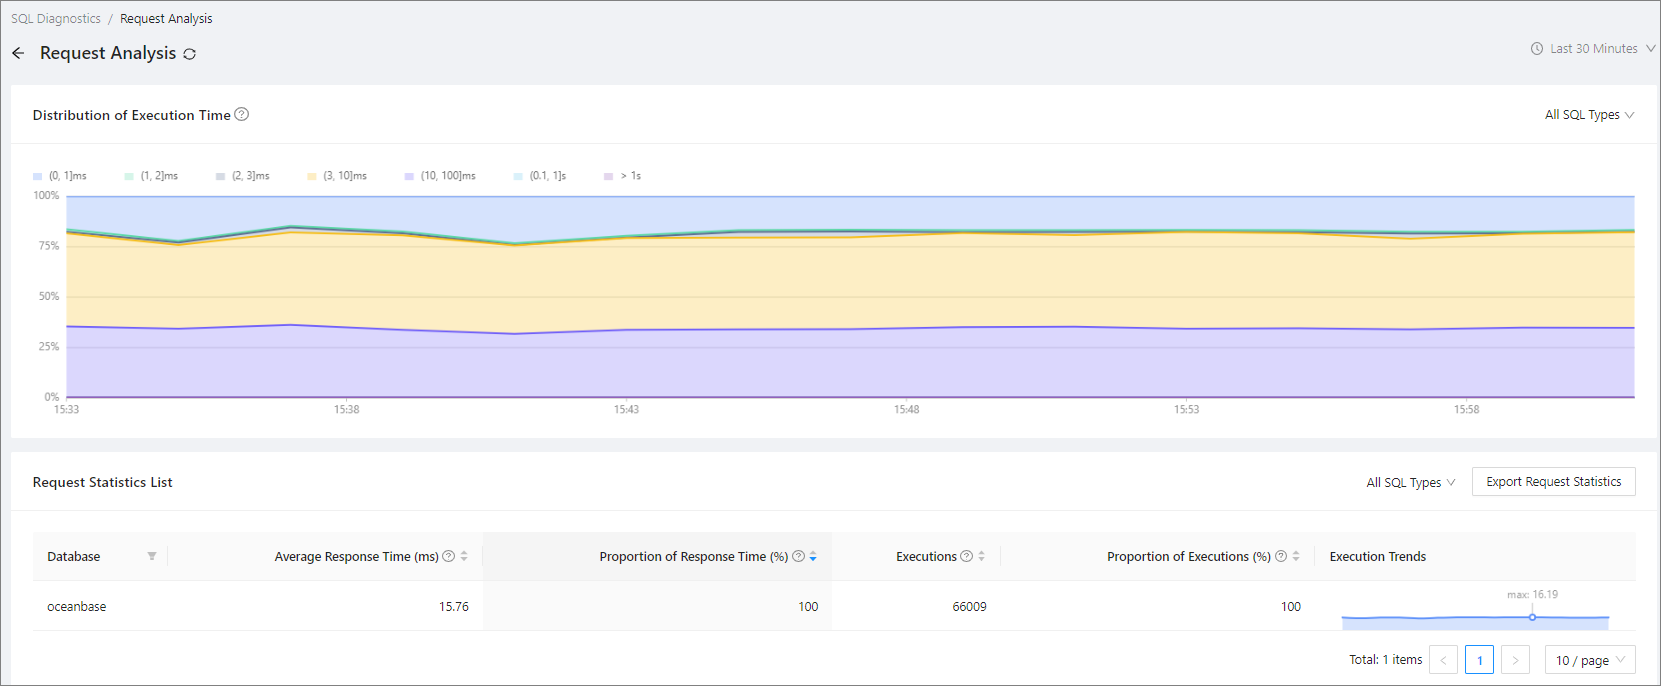
This topic describes how to view the execution time distribution of different types of SQL statements to understand the overall execution status of SQL statements. The data for SQL request analysis is sourced from the diagnostic data of top SQL statements.
You can view SQL request analysis data by using the following methods:
Method 1: Log in to the OceanBase Cloud Platform (OCP) console. In the left-side navigation pane, click OceanBase Autonomy Service. On the page that appears, find the target cluster and click its name to go to the Real-time Diagnostics page.
Method 2: Log in to the OCP console. On the Overview page of a tenant, click SQL Diagnostics in the left-side navigation pane.
Applicability
OCP Community Edition does not support OceanBase Autonomy Service. To use this service, go to the relevant page by using Method 2.
Prerequisites
To view SQL request analysis data by using Method 1, make sure that you have the following permissions:
- Resource Permissions: Cluster Read-only or Tenant Read-only permission
- Menu Permissions: Permission on the Real-time Diagnostics menu of OceanBase Autonomy Service
To view SQL request analysis data by using Method 2, make sure that you have the following permissions:
- Resource Permissions: Cluster Read-only or Tenant Read-only permission
- Menu Permissions: Permission on the SQL Diagnostics menu of Tenants
Your password box contains the tenant password, if the current tenant is in MySQL mode.
Your password box contains the password of the sys tenant in the cluster, if the current tenant is in Oracle mode.
Procedure
The procedure of Method 1 is described as follows:
In the left-side navigation pane, click OceanBase Autonomy Service. On the Cluster Details page, click the name of the target cluster to go to its Real-time Diagnostics page.
By default, the SQL Diagnostics tab appears.
Click View Request Analysis.
On the request analysis details page, you can view the trend chart of execution time distribution and the request statistics list. By default, the system displays data of the last 30 minutes. If you change the statistical period, the system automatically updates Distribution of Execution Time and Request Statistics List based on the specified period.
View the trend chart of execution time distribution.
Distribution of Execution Time displays the execution time distribution of SQL statements in the specified period. By default, the system displays the data of all SQL statements. You can select an SQL statement type, such as SELECT, INSERT, UPDATE, DELETE, or REPLACE, to view the execution time distribution of the specific SQL statement type.
The execution time is divided into seven ranges and calculated every minute.
Range Description [0,1]ms The proportion of SQL executions that take a time more than or equal to 0 ms but less than or equal to 1 ms. (1,2]ms The proportion of SQL executions that take more than 1 ms but less than or equal to 2 ms. (2,3]ms The proportion of SQL executions that take a time more than 2 ms but less than or equal to 3 ms. (3,10]ms The proportion of SQL executions that take more than 3 ms but less than or equal to 10 ms. (10,100]ms The proportion of SQL executions that take more than 10 ms but less than or equal to 100 ms. (0.1,1]s The proportion of SQL executions that take more than 0.1s but less than or equal to 1s. >1s The proportion of SQL executions that take more than 1s. 
View the request statistics list.
Request Statistics List shows the average response time, proportion of response time, number of executions, proportion of executions, and execution trend (based on the average response time) of the database requests. You can perform the following operations on Request Statistics List:
Filter databases by database type.
Sort databases by average response time, proportion of response time, number of executions, or proportion of executions. By default, the system sorts the databases by response time.
Select an SQL statement type from the drop-down list in section ① in the figure to view the execution time distribution of a specific SQL statement type.
Click Export Request Statistics in section ② in the figure to export the request statistics list in the Excel format.


