


Version information
Performance reports vary by the OCP version. This topic uses OCP V3.3.0 as an example.
Architecture
OceanBase Analyze Report (OBAR) provides database performance analysis to help you comprehensively diagnose OceanBase Database performance issues. OBAR aims to keep users informed of cluster and tenant loads and performance to help users execute general inspections and learn about the inspection results in the form of reports. These reports are easy to operate on. You can aggregate the system status information in multiple dimensions and learn about the cluster status with a few clicks.
The following figure shows the OCP task framework for generating a performance report.
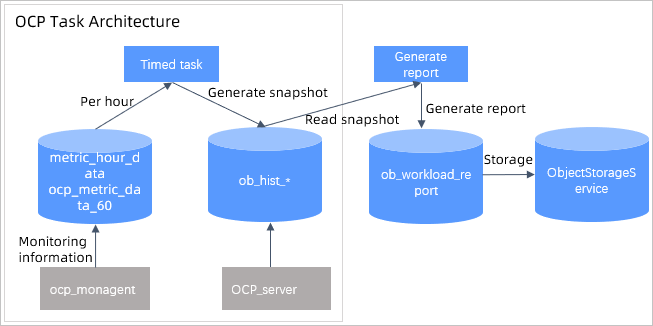
The OCP monitoring data collection module regularly collects the required monitoring data and writes the data to MonitorDB.
- The OCP server collects data every hour and stores the data in the ob_hist * table.
- The ocp_monagent collects data every 30 seconds and stores the data to MonitorDB.
The OCP task framework collects snapshot statistics as scheduled. The scheduled task is called snapshot_producer. The snapshot_producer task reads required monitoring information from the monitoring data, processes the information into snapshots, and writes the snapshots to the
ob_hist_*table. To accelerate snapshot statistics processing, the system splits tasks based on the monitoring data type and collects diagnostic information concurrently by using subtasks in the task framework.The OCP task framework provides interfaces to support the following operations.
Generating reports
- You can specify the starting and ending snapshot points to generate a report.
- Before generating a report, the system checks the report data. If a snapshot between the starting snapshot point and the ending snapshot point has an error, the system rejects to generate the report. In addition, the system will reject to generate a report if the server goes online or offline.
- After the report data passes the check, the system writes the current report metadata to ob_workload_report and changes the report status to "Generating". After the task succeeds or fails, the system updates the report status to "Successful" or "Failed".
- The system generates a report based on local resource files and snapshot data and stores successfully generated reports in ObjectStorageService.
Querying and downloading reports
- The system queries the list of report descriptions from
ob_workload_reportand returns it to the frontend. - The system queries the corresponding report description from
ob_workload_report, obtains the report content from ObjectStorageService, and then returns the report content to the frontend.
- The system queries the list of report descriptions from
Report description
A performance report contains the following sections: Basic Information, Workload Statistics, SQL Statistics, Lock Statistics, Cache Statistics, RPC Statistics, and Parameter Changes.
Basic information
The following table lists all the basic information about the resources, nodes, and tenants in the cluster.
Item |
Description |
|---|---|
| Basic Cluster Information | Includes the cluster version, cluster type, number of hosts, number of tenants, and start time and end time of the last major compaction. |
| Node Basic Information | Includes the host IP address, zone, availability of Root Server, status, service start time, and time of the last deletion. |
| Node Resources | Includes the host IP address, zone, total CPU cores, allocated CPU cores, allocated CPU resources in percentage, total memory in MB, allocated memory in MB, allocated memory in percentage, disk usage in GB, and disk usage in percentage. |
| Node Partitions | Includes the host IP address, zone, associated tenants, number of partitions, and number of leader partitions. Note that the number of partitions includes the number of leader partitions. |
| Tenant Resources | Includes the tenant name, tenant ID, tenant type, resource unit configuration, zone priority, locality, and list of servers. |
| Tenant Capacity | Includes the associated tenants, tenant ID, associated hosts, and data capacity. |
Workload statistics
Workload statistics include the statistics of data operation load-related metrics for clusters and tenants, such as the cumulative values, start values, end values, maximum values, maximum value occurrence time, minimum values, minimum value occurrence time, and average values.
You can obtain the following information from the table:
db_time: the workload of the database.db_cpu: the CPU time consumed by the database. Time consumed for non-idle waits =db_time-db_cpu.Database request statistics, including statistics on
SELECT,INSET,DELETE, andUPDATEstatements, which help you learn more about the business.Optimization space for the execution of SQL statements. If a large number of SQL statements are executed remotely or in a distributed manner, you can bind a table group or modify partitions to optimize the table definition.
The status of database transactions. If too many transactions are rolled back, the database may not be properly running and will consume database resources improperly. In this case, you must identify the cause.
Network communication. A large number of network requests received and sent will consume a lot of network bandwidth resources and result in additional costs.
The specific metrics include:
Type |
Statistic item |
Description |
|---|---|---|
| SQL statement executions | sql_select_count | The number of SELECT statement executions. |
| SQL statement executions | sql_insert_count | The number of INSERT statement executions. |
| SQL statement executions | sql_delete_count | The number of DELETE statement executions. |
| SQL statement executions | sql_update_count | The number of UPDATE statement executions. |
| SQL statements by type | sql_local_count | The number of local SQL statement executions. |
| SQL statements by type | sql_remote_count | The number of remote SQL statement executions. |
| SQL statements by type | sql_distributed_count | The number of distributed SQL statement executions. |
| Database time statistics | db_time | The database time consumed (s). |
| Database time statistics | db_cpu | The database CPU time consumed (s). |
| Transaction statistics | transaction_count | The number of transactions. |
| Transaction statistics | rollbacks | The number of rolled back transactions. |
| Transaction statistics | transaction_rt | The time consumed in executing transactions (ms). |
| Transaction statistics | rollback_rt | The time consumed in rolling backup transactions (ms). |
| RPC statistics | rpc_packet_in | The number of bytes received in RPC requests. |
| RPC statistics | rpc_packet_out | The number of bytes sent in RPC requests. |
| RPC statistics | rpc_packet_in_rt | The time consumed for receiving RPC requests. |
| Storage layer read/write statistics | logical_read_row_count | The number of logical read rows. |
| Storage layer read/write statistics | physical_read_row_count | The number of physical read rows. |
SQL statistics
The following table lists the statistic metrics in different dimensions on top SQL statements to help you learn about resource consumption by different SQL statements.
Item |
Description |
|---|---|
| SQL Sorted by Total Response Time | |
| SQL Sorted by CPU Time | |
| SQL Sorted by I/O Latency | |
| SQL Sorted by Network Latency | |
| SQL Sorted by Logical Reads | |
| SQL Sorted by Physical Reads | |
| SQL Sorted by Executions | |
| SQLs Sorted by Number of Remote Plan Executions | |
| SQLs Sorted by Distributed Plan Executions | |
| SQL Sorted by Affected Rows | |
| SQL Texts | Displays the information of all the preceding SQL statements. |
Lock statistics
Item |
Description |
|---|---|
| Row Lock Statistics | The number of applications, waits, timeouts, and wait time of row locks in a tenant. |
| Latch Statistics | You can view the following statistics on latches in a tenant: |
Cache statistics
This module provides the average key-value cache hit rate of tenants. The statistic data source is the gv$systat view in OceanBase Database. The cache hit rate is accurate to two decimal places. You can view the statistics of seven types of caches: Block Cache, Block Index Cache, Clog Cache, Clog Index Cache, BloomFilter Cache, Location Cache, and Row Cache.
Different caches are used in different stages of SQL statement execution. If a certain cache has a significantly low hit rate, it undermines the SQL execution efficiency. Therefore, the information is key to performance optimization.
Statistical information includes the following:
Parameter |
Description |
|---|---|
| Cache Hit Rate | The hit rates of different types of caches in different tenants in the snapshot period. |
| Cache Request | Information about caches and cache requests in different tenants in the snapshot period, such as the number of cache requests, cache hits, and cache mishits. |
| Cache Size | The size of different types of caches in different tenants in the snapshot period. The start and end positions are displayed. |
RPC statistics
The finer-granule statistics on RPC communication packets. The information helps you learn about the network bandwidth resource consumption and thereby quickly locate problems caused by insufficient network resources.
Parameter |
Description |
|---|---|
| Total RPCs | The number and size of RPCs, RPC latencies, and the number of failed RPCs collected in dimensions of tenant and host. Sort RPCs by RPC size and display the Top 10 results. |
| Package Code RPC | Sort RPCs by package code and display the Top 10 results. |
| Clog RPC | Information about Clog RPCs collected in dimensions of tenant and host, such as the number of all Clog RPCs and successful Clog RPCs, and total time consumed by successful Clog RPCs. |
| GTS RPC | The number of GTS RPCs collected in dimensions of tenant and host. |
| Location Cache RPC | Information about Location Cache RPCs collected in dimensions of tenant and host, such as the number of all cache refreshes, cache refreshes by RPCs, and failed cache refreshes by RPCs. |
Parameter Changes
This module provides information about the changes of the parameters collected in dimensions of cluster, zone, server, and tenant in the snapshot period.
Parameter changes before and after a fault can help us more quickly understand changes in the cluster and troubleshoot faults caused by parameter changes.
Partition management
Performance data are sorted by day. Each partition records data for one day. By default, a partition is created 8 days (specified in ocp.perf.sql.prepare-partition-ahead) in advance. Outdated data is cleared by partition based on the retention period specified in the table.
Table name |
Partitioning rule |
Partition retention time |
Module involved |
Note |
|---|---|---|---|---|
| ob_hist_snapshot | Monthly | 93 days | AWR Report | Cluster snapshots |
| ob_hist_cluster | Monthly | 93 days | AWR Report | Snapshots of basic cluster information |
| ob_hist_tenant | Monthly | 93 days | AWR Report | Snapshots of cluster tenant information |
| ob_hist_sysstat | Monthly | 93 days | AWR Report | Workload statistics |
| ob_hist_replica | Monthly | 93 days | AWR Report | Replica distribution |
| ob_hist_server | Monthly | 93 days | AWR Report | Snapshots of OBServer information in the cluster |
| ob_hist_row_lock | Monthly | 93 days | AWR Report | Row lock snapshots |
| ob_hist_latch | Monthly | 93 days | AWR Report | Latch snapshots |
| ob_hist_rpc | Monthly | 93 days | AWR Report | Snapshots of cluster RPC information |
| ob_hist_packet | Monthly | 93 days | AWR Report | Snapshots of cluster packet information |
| ob_hist_location_cache | Monthly | 93 days | AWR Report | Snapshots of location cache information in the cluster |
| ob_hist_clog | Monthly | 93 days | AWR Report | Snapshots of cluster Clog information |
| ob_hist_gts | Monthly | 93 days | AWR Report | Snapshots of cluster GTS information |
| ob_hist_cache | Monthly | 93 days | AWR Report | Snapshots of basic cluster information |
| ob_hist_parameter | Monthly | 93 days | AWR Report | Historical changes of cluster parameters |
| ob_hist_system_event | Monthly | 93 days | AWR Report | Records of wait events |