


Currently, for many companies, relational databases are still the main data storage engines, and the business systems access the databases by using SQL statements. As an important component of an IT system, SQL statements play an important role in performance metrics such as system availability, user response time, system throughput, and IT facility cost. Issues caused by SQL statements occur time after time.
First of all, writing good SQL statements is not easy, because it requires a deep understanding of the database principles and business requirements. R&D engineers usually have insufficient knowledge about databases, whereas DBAs cannot understand numerous business requirements.
In addition, for a large system, SQL statements are usually large in quantity and change frequently. As a result, it is usually impossible for professional DBAs to work with an R&D team in optimizing each SQL statement.
Also, even optimized SQL statements may become improper to execute someday due to factors such as data and database version changes. When this happens, these databases can be accompanied by high risks and emergency costs.
Providing the professional SQL diagnosis capability as a service is crucial for large database-intensive I/O systems. Therefore, OCP provides a multi-dimensional SQL diagnosis feature, covering TopSQL, SlowSQL, ParallelSQL, suspicious SQL, SQL Plan, Outline, SQLTuningAdvisor, and SQL request analysis to help you cope with different application scenarios. In addition, OCP provides emergency tuning features such as SQL tuning recommendations, index binding, plan binding, SQL throttling, and keyword throttling, providing the whole-process SQL problem identification, analysis, and processing capabilities.
Version information
The SQL diagnosis feature varies based on the OCP version. This topic uses OCP V3.3.0 as an example.
Top SQL statements
Features
TopSQL collects the SQL statement execution statistics by SQL ID. You can use the TopSQL feature to analyze the user request behavior and sort SQL statements by resource consumption. Then, you can identify SQL requests with exceptions and thereby improve the SQL statement execution performance.
You can also define a calculation rule with an expression for a custom column in TopSQL. Then TopSQL calculates and sorts data for the custom column. TopSQL also supports advanced filtering. You can configure an expression to locate SQL statements that meet specific conditions.
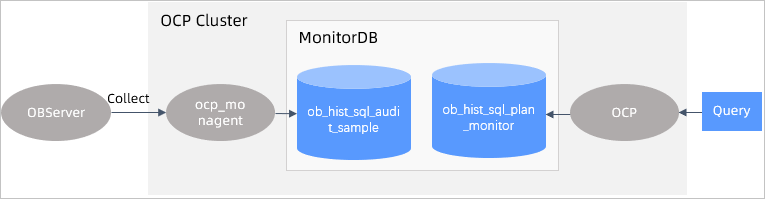
The following figure shows the framework of the TopSQL feature.
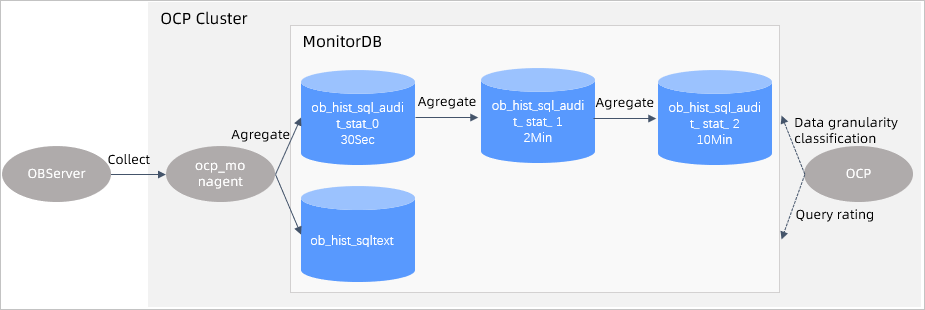
The TopSQL feature mainly involves the following three components:
ocp_monagent, the data collection process on the OBServer end. It collects incremental data from
v$ SQL _auditon the OBServer node every 30s. Then, it summarizes the data by SQL ID, filters out unworthy data, and writes data directly to MonitorDB.- `ob_hist_sql_audit_stat_0: The SQL summary data in a 30s window. The summary information includes ob_tenant_id, collect_time, ob_server_id, ob_db_id, ob_user_id, and sql_id.
ob_hist_sqltext: the SQL metadata, including the tenant name, username, database name, SQL ID, and raw SQL string.
OCP processes the raw sampling data (
ob_hist_sql_audit_stat_0) and aggregates the SQL sampling data in different time granules, so as to support metric query in different granules and fine-grained diagnosis.ob_hist_sql_audit_stat_1: SQL summary data in a 2-minute window.ob_hist_sql_audit_stat_2: SQL summary data in a 10-minute window.
The data query logic in OCP. OCP queries performance data and displays the data on the frontend. You can select a level based on the length of the query time range.
ob_hist_sql_audit_stat_0: supports TopSQL queries within 2 hours in the last 2 days.ob_hist_sql_audit_stat_1: supports TopSQL queries from 2 hours to 12 hours.ob_hist_sql_audit_stat_2: supports TopSQL queries for more than 12 hours.
Parameters
Parameters
Configure data collection in GUI
You can enable or disable data collection at the cluster level. After data collection is disabled, the system displays the corresponding notification when SQL diagnosis is available. If data collection is disabled for a specified period, the system displays the corresponding notification about this period when you query the corresponding historical information.
Query configuration
The following table describes the parameters for top SQL user queries. You can adjust the values by setting the system parameters in OCP.
DimensionParameterDefault valueDescriptionData granularity ocp.perf.sql.sql-hist-level0-granularity 30s The time granule of Level 0 SQL performance data. We recommend that you use the default value. Data granularity ocp.perf.sql.sql-hist-level1-granularity 2 m The time granule of Level 1 SQL performance data. We recommend that you use the default value. Data granularity ocp.perf.sql.sql-hist-level2-granularity 10 m The time granule of Level 2 SQL performance data. We recommend that you use the default value. Query time ocp.perf.sql.sql-hist-level0-query-interval > 2 h The maximum time range for querying the Level 0 SQL performance data. Query time ocp.perf.sql.sql-hist-level1-query-interval > 2 h, < 12 h The maximum time interval for querying the Level 1 SQL performance data. Query time ocp.perf.sql.sql-hist-level2-query-interval > 12 h The maximum time interval for querying the Level 2 SQL performance data. Partition retention time ocp.perf.sql.sql-hist-level0-retention 2 d The retention period for partitions of Level 0 SQL performance data. Partition retention time ocp.perf.sql.sql-hist-level1-retention 8 d The retention period for partitions of Level 1 SQL performance data. Partition retention time ocp.perf.sql.sql-hist-level2-retention 15 d The retention period for partitions of Level 2 SQL performance data. Partition management
Performance data
ob_hist_sqltextandob_hist_sql_audit_stat_*are sorted by day. Each partition records data for one day. A partition is created 8 days (specified inocp.perf.sql.prepare-partition-ahead) in advance by default. Outdated data is cleared by partition based on the retention period specified in the table.
SQL plans
Features
Performance views in OceanBase Database are dynamically updated. Therefore, it is difficult to directly find historical execution plans in OceanBase Database. The SQL Plan module of OCP provides the execution plan management feature by continuously collecting information about SQL execution plans. On SQL Plan, you can learn about the following information:
SQL execution plans for the last 7 days
Whether an SQL execution plan has been changed frequently
On the SQL Diagnostics page, you can click an SQL statement on the SQL list to go to the details page of the SQL statement. In addition to the SQL execution statements displayed in a formatted format, the history of the SQL execution plans is displayed, including the following information:
Historical trends of execution plans
The execution plan list and operator details.
When you find that an SQL historical plan is excellent, you can use the outline feature to bind the plan to improve SQL execution.
Architecture
The following figure shows the framework of the SQL plan feature.
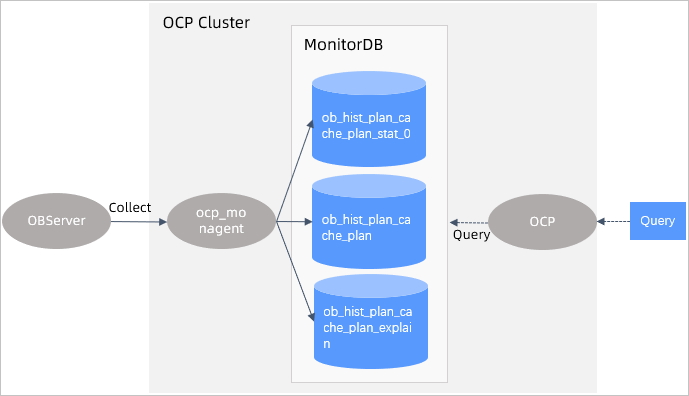
An execution plan helps you troubleshoot SQL performance issues from the perspective of execution plans. You can check whether an execution plan meets your expectations and check an execution plan for frequent changes and input, output, and cost of each operator in the plan.
The execution plan diagnosis feature involves the following two modules:
ocp_monagent, the data collection process on the OBServer end. It collects full data from
v$plan_cache_plan_statand incremental data fromv$plan_cache_plan_explainon the OBServer node every 30s, and saves the data in MonitorDB.ob_hist_plan_cache_plan_stat_0: records the cumulative execution details of each plan in a 30s statistical cycle.ob_hist_plan_cache_plan: records the metadata of each plan, including the generation time, plan hash, and schema version.ob_hist_plan_cache_plan_explain: records the structure of each plan in the execution operator dimension.
The query interface on OCP, which provides the execution plan details and historical trend charts.
Parameters
Configure data collection in GUI
You can enable or disable data collection at the cluster level. After data collection is disabled, the system displays the corresponding notification when SQL diagnosis is available. If data collection is disabled for a specified period, the system displays the corresponding notification about this period when you query the corresponding historical information.
Query configuration
The following table describes the parameters for SQL plan user queries. You can adjust the values by setting the system parameters in OCP. The parameter that you can configure is described in the following table.
ParameterDefault valueDescriptionocp.perf.sql.plan-hist-level0-retention 8 d The period for retaining performance data partitions of plans. Partition management
Performance data are sorted by day. Each partition records data for one day. By default, a partition is created 8 days (specified in
ocp.perf.sql.prepare-partition-ahead) in advance. Outdated data is cleared by partition based on the retention period specified in the table.
SlowSQL
Features
SlowSQL is an SQL statement whose execution time exceeds the specified threshold (100 ms by default). You can set different SlowSQL thresholds based on your business scenarios. SlowSQL has the following impacts:
Slow user response and long response time
Large system resource consumption, even system unavailability in extreme cases
Therefore, to ensure system stability, you must collect and analyze SlowSQL statistics to identify issues and avoid risks in an early stage. The SlowSQL feature focuses on the information about a single SQL execution. OCP samples data from v$sql_audit in OceanBase Database to allow you analyze the resource consumption and execution details of SlowSQL from various dimensions.
Statistics sampling on a single SQL execution is needed in more generic scenarios, such as TopSQL and SlowSQL. Therefore, the background of SlowSQL is based on v$sql_audit, while the scenarios that it supports are not limited to SlowSQL.
The architecture diagram for SlowSQL statistics collection is similar to that of TopSQL statistics collection, except that OCP does not need to process and summarize data before service delivery in SlowSQL statistics collection.
Architecture
The following figure shows the framework of the SlowSQL feature.
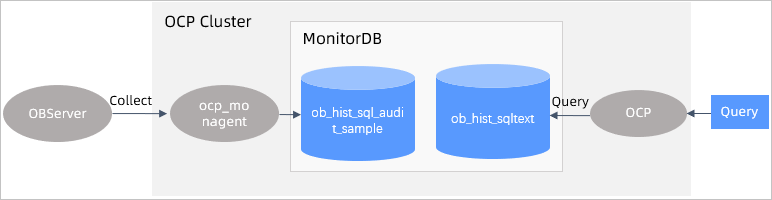
The SlowSQL feature involves the following two modules:
ocp_monagent, the data collection process on the OBServer end. It collects SQL execution details that meet the SlowSQL threshold from the
v$sql_auditview on the OBServer node every 30s. Then, it saves the data to MonitorDB. It does not collect the sqltext content. Instead, it reuses the data collected by TopSQL.ob_hist_sql_audit_sample: records an SQL execution whose execution time exceeds the threshold in each row.
The slow SQL query interface on OCP.
Parameters
Configure data collection in GUI
You can enable or disable data collection at the cluster level. The switch is similar to that of TopSQL.
Partition management
Performance data are sorted by day. Each partition records data for one day. By default, a partition is created 8 days (specified in
ocp.perf.sql.prepare-partition-ahead) in advance. Outdated data is cleared by partition based on theocp.perf.sql.sql-audit-sample-retentionparameter. The default value is 7 days. The following table describes the parameters.ParameterDefault valueDescriptionocp.perf.sql.sql-audit-sample-retention 7 d The retention period for SqlAudit sampling data.
Suspicious SQL statements
Features
If an SQL statement is executed with poor performance, the system identifies the SQL statement as a suspicious SQL statement based on the experience of experts and displays it in OCP. This feature provides you with clear guidance on SQL performance tuning.
SQL diagnostics processes and analyzes the TopSQL collection data in OCP to identify suspicious SQL statements. The data source for SQL diagnostics is the same as that for TopSQL. The base data of each diagnostic item is obtained from the MonitorDB metadata in OCP. OCP diagnoses the objects based on certain rules, such as the CPU time and execution frequency. For index-related diagnostics, OCP directly queries OceanBase clusters for the index structure information.
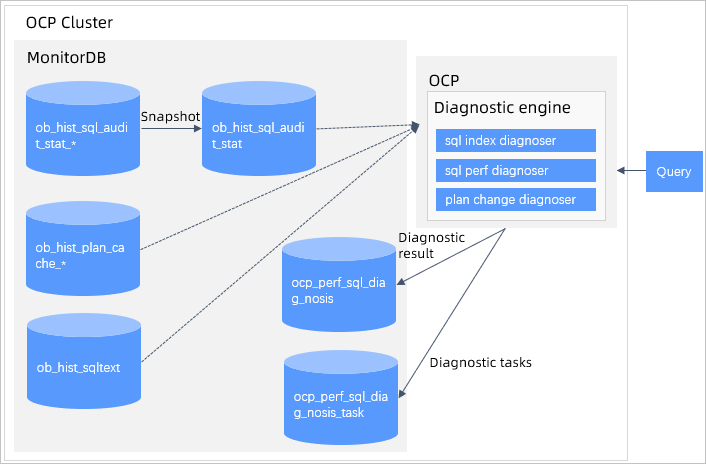
Architecture
The suspicious SQL diagnostics feature involves the following two modules:
The MonitorDB data source, which is the TopSQL and SQL Plan information collected by ocp_monagent.
The OCP snapshot generation module. OCP summarizes incremental SQL execution data in
ob_hist_sql_audit_stat_0every hour byob_tenant_id,ob_server_id,ob_db_id, andsql_id.
The suspicious SQL diagnostics engine encompasses the following three submodules:
SQL index diagnoser: analyzes SQL statements with index issues by using data from
ob_hist_sql_audit_stat_0. When metrics, such as cpu_time, ofsql_auditexceed the diagnostic item settings, the submodule extracts the data entry for diagnosis and analyzes the subexecution plan or table structure. When a new SQL index is identified as abnormal, the submodule generates an event and writes it to the database.SQL perf diagnoser: analyzes SQL statements with performance issues by using data from
ob_hist_sql_audit_stat_0. When metrics ofsql_audit, such as cpu_time, exceed the diagnostic item settings, the submodule extracts the data entry and analyzes the resource usage, variation, and change in execution counts. When the SQL statement meets the specified conditions, the submodule generates an event and writes it to the database.Plan change diagnoser: analyzes SQL execution plans by using data from
ob_hist_plan_cache_plan. When the SQL Plan statistics change and performance degrades in the scanning event period, the submodule generates a corresponding event and writes it to the database.
The job details of the diagnostic engine module are recorded in ocp_perf_sql_diagnosis_task and the suspicious SQL statements identified are recorded in ocp_perf_sql_diagnosis.
Currently, OCP supports nine diagnostic items for suspicious SQL statements. The following table describes these diagnostic items:
Diagnostic module |
Diagnostic type |
Parameter |
Risk levels |
Description and suggestion |
|---|---|---|---|---|
| SQL index diagnoser | Table scan without available index | ocp.perf.sql-diag.table-scan-index-not-exists-config | High | During the execution of the SQL statement, a full table scan was performed on some related tables because they did not have indexes available. We recommend that you create appropriate indexes. |
| SQL index diagnoser | Table scan with unused index | ocp.perf.sql-diag.table-scan-index-not-exists-config | High | All tables involved in the execution of the SQL statement are indexed. However, a full table scan was performed on some of these tables because their indexes were not used. Check the data distribution and business scenario. |
| SQL index diagnoser | Hint with no effect | ocp.perf.sql-diag.ineffective-hint-config | High | An index was specified in the hint of the SQL statement, but the specified index was not used during execution. Check whether the hint of the SQL statement matches the actual execution plan. |
| SQL index diagnoser | Poor performance despite the use of index | ocp.perf.sql-diag.awful-performance-index-used-config | Medium | The index was used for table access during the execution of the SQL statement, but the performance was poor. Check the data distribution and business scenario. |
| plan change diagnoser | Plan change accompanied by performance degradation | ocp.perf.sql-diag.performance-degradation-after-plan-changed-config | High | The execution plan of the SQL statement was changed, and the performance of the new plan was degraded. Check with the DBA. You can use an outline to fix the execution plan to verify whether the SQL statement is problematic. |
| SQL perf diagnoser | Performance degradation | ocp.perf.sql-diag.performance-degradation-config | Medium | During the diagnosis period, the average CPU time consumed for the execution of the SQL statement is longer than the historical average. Check the changes in data distribution and the queue in the tenant. |
| SQL perf diagnoser | Execution spikes | ocp.perf.sql-diag.execution-spike-config | Medium | The executions of the SQL statement suddenly increased during a period. You can view the number of executions in the Historical Trends tab of the SQL Details. Check the business volume. A spike in the number of executions of an SQL statement may cause the overall performance to decrease. |
| SQL perf diagnoser | Row lock contention | ocp.perf.sql-diag.row-lock-contention-high-config | Medium | Check your business scenarios, whether the SQL statements of the select for update type were executed more frequently than the specified value, and whether the CPU time was greater than the specified value. |
| SQL perf diagnoser | CPU utilization above threshold | ocp.perf.sql-diag.cpu-time-proportion-high-config | Low | The CPU utilization is too high during the diagnosis period. The CPU utilization = CPU time for executing the SQL statement/CPU time for executing all SQL statements of the tenant * 100%. Check your business scenarios, data distribution changes, request increases, and execution plan changes. |
Parameters
The default values of execution times and average response time are relatively high for the diagnosis items in OCP. You can adjust the configuration parameters of these diagnostic items based on the actual environment. The following table describes the parameters.
Parameter |
Default value |
Comments |
|---|---|---|
| ocp.perf.sql-diag.table-scan-index-not-exists-config | null | The diagnostic parameter for the full-table scan without any indexes available. |
| ocp.perf.sql-diag.table-scan-index-not-used-config | {"enabled":true, "execPsLimit":5.0, "cpuTimeLimitUs":20000} | The diagnostic parameter for a full-table scan without using the index. |
| ocp.perf.sql-diag.ineffective-hint-config | {"enabled":true, "execPsLimit":5.0, "cpuTimeLimitUs":20000} | The diagnostic parameter for inactive hints. Parameters: |
| ocp.perf.sql-diag.awful-performance-index-used-config | {"enabled":true, "cpuTimeLimitUs":100000, "execPsLimit":5.0, "fullLogicalReadsLimit":10000} | The diagnostic parameter for poor performance with the use of index. Parameters: |
| ocp.perf.sql-diag.performance-degradation-after-plan-changed-config | {"enabled":true, "compareMin":5, "cpuTimeMultiply":{"0":50, "1":30, "10":10, "100":8, "1000":6}} | The diagnostic parameter for changes in the execution plan and performance degradation. Parameters: |
| ocp.perf.sql-diag.performance-degradation-config | {"enabled":true, "cpuTimeLimitUs":10000, "execPsLimit":5.0, "maxCpuTimeLimitUs":30000, "affectedRowsLimit":100, "execLimit":5, "compareMin":20, "cpuTimeMultiply":{"0":50, "1":30, "10":10, "100":8, "1000":6}} | The diagnostic parameter for performance degradation. Parameters: |
| ocp.perf.sql-diag.execution-spike-config | {"enabled":true, "cpuTimeLimitUs":3000, "execPsLimit":5.0, "pointsLimit":5, "compareMin":20, "avgExecutionMultiply":{"0":6, "1":5, "5":4, "10":3, "50": 2.5, "100": 2, "500": 1.6}, "stdExecutionMultiply":{"0":80, "1":60 , "3": 30,"5":20, "10":15, "20":8, "30":6, "50":5, "80":4}} | The diagnostic parameter for execution spikes. Parameters: enabled: specifies whether to enable this check item. execPsLimit: the execution frequency, which is the number of executions per second. cpuTimeLimitUs: the average CPU time, in microseconds. pointsLimit: the number of points. compareMin: the time difference, in minutes. avgExecutionMultiply: the multiple of the current execution efficiency relative to the average execution frequency. stdExecutionMultiply: the multiple of the current execution efficiency relative to the standard deviation of the execution frequency. The multiple is calculated in the same way as the CPU multiple described above. |
| ocp.perf.sql-diag.row-lock-contention-high-config | {"enabled":true, "execPsLimit":5.0, "cpuTimeLimitUs":100000, "elapsedTimeLimitUs":0} | The diagnostic parameter for high row lock contention. Parameters: |
| ocp.perf.sql-diag.cpu-time-proportion-high-config | {"enabled":true, "cpuTimeLimitUs":10000, "execPsLimit":10.0, "maxCpuTimeLimitUs":30000, "affectedRowsLimit":100, "execLimit":30, "sqlCountLimit":20, "cpuTimePercentLimit":20} | The diagnostic parameter for a high CPU time percentage for execution. Parameters: |
| ocp.perf.sql-diag.database-white-list | oceanbase,information_schema,mysql,__recyclebin,sys,__public | The names of the databases to be skipped in SQL diagnostics. |
Partition management
The following table describes the partition management rules for the diagnostic history table.
Parameter |
Default value |
Description |
|---|---|---|
| ocp.perf.sql-diag.sql-diagnosis-retention-days | 30 d | The retention period for suspicious SQL diagnosis results. |
| ocp.perf.sql-diag.diagnosis-task-retention-days | 30 d | The retention period for suspicious SQL diagnosis task records. |
Performance data are sorted by day. Each partition records data for one day. By default, a partition is created 8 days (specified in ocp.perf.sql.prepare-partition-ahead) in advance. Outdated data is cleared by partition based on the retention period specified in the table.
Outline
The Outline feature of OCP allows you to bind execution plans to SQL statements or enable throttling for the SQL statements. Currently, the Outline feature of OCP supports the following operations:
Index binding: You can bind the index for SQL execution.
Plan binding: You can bind a historical plan for SQL execution.
SQL throttling: You can control the concurrency for SQL execution.
Keyword throttling: You can control the concurrency for SQL execution with specific parameters.
After abnormal SQL statements are identified with the preceding SQL diagnostic feature, for performance issues caused by improper SQL execution plans, you can choose to:
Bind the SQL execution plan by binding a plan or index.
Throttle SQL execution to control the concurrency for SQL execution.
Throttle SQL execution with specific parameters. In this case, only SQL statements with parameters set to specific values are throttled. This corresponds to throttling on large accounts in the business.
The outline feature helps you solve issues in the following scenarios:
The database optimizer has defects and may use incorrect execution plans for some scenarios. For example, the optimizer may choose an execution plan other than the optimal one based on cost computation upon statistical information when there is a large amount of incremental data. In this case, a better index must be bound.
A historical execution plan is better than the current execution plan and must be bound.
When SQL request load is heavy on the database, user requests must be slowed down for the database.
When SQL request load is heavy on the database, most SQL statements query or update records within a fixed range.
The index binding, execution plan management and plan binding, SQL throttling, and keyword throttling features provided by OCP can meet the requirements.
SQL query analysis
SQL query analysis is a supplement to TopSQL. The data that it analyzes comes from TopSQL. SQL query analysis provides statistical analysis on the number of SQL executions and execution time. By using SQL query analysis, you can learn about the distribution of time consumed by different types of SQL statements executed by tenants within a specified period, as well as the proportion of different types of SQL statements executed for each database and the trend of execution time, as shown in the following figure.
To analyze a large amount of data, when the query interval is no more than 30 minutes (specified for the ocp.perf.sql.sql-query-digest-level0-query-interval parameter), SQL query analysis uses ob_hist_sql_audit_stat_0 as the data source. When the query interval (specified for the ocp.perf.sql.sql-query-digest-level1-query-interval parameter) is more than 30 minutes but no more than 2 hours, SQL query analysis uses ob_hist_sql_audit_stat_1 as the data source. For other query intervals, it uses ob_hist_sql_audit_stat_2 as the data source.
SQLTuningAdvisor
On the SQL details page, OCP provides optimization suggestions based on the SQL execution history and SQL structure.
The suggestions cover CPU scale-out, execution plan recommendation, and index recommendation.
Index recommendation
When the average CPU time of SQL queries is no less than 10 ms or the average response time is no less than 20 ms, OCP analyzes the SQL query conditions and provides recommendations on index creation. The sorting rules for the indexed columns are:
The equivalent columns are followed by the range query columns.
The equivalent columns with a larger number of distinct values (NDV) are followed by those with a small NDV.
Range query columns with a smaller query range are followed by those with a larger query range. When calculating the query range, the values of the default column are evenly distributed. The query range is the ratio of the query interval to the value range of the column.
If the SQL statement contains multiple range query columns, indexing is not used for columns other than the first range query column. When creating an index, you can decide whether to include all range query columns. For example, if the index allows, you can include all condition columns to the index to avoid table access by index primary key, thereby reducing resources consumed by table access by index primary key. Because table statistics are collected only during the major compaction of a cluster, for new tables and newly imported data, OCP can obtain the column NDV, maximum value, minimum value, and other information only after a major compaction of the cluster. Without a major compaction, index recommendations are not available.
The index supports the following SQL statements: SELECT, SELECT_FOR_UPDATE, UPDATE, and DELETE.
Execution plan recommendations
OCP analyzes the SQL execution plans over the past week, groups them by execution plan type, and identifies the execution plan with the optimal average CPU time in the group. When the average CPU time of the optimal execution plan in the Local and Distribute groups is 20% lower than the average CPU time of the execution plans for the same type, OCP recommends that the user bind this execution plan. Plan binding supports the following SQL statements: SELECT, SELECT_FOR_UPDATE, UPDATE, DELETE, MERGE, REPLACE, and INSERT.
CPU scale-out recommendation
For a DML SQL statement, if the average CPU utilization in the tenant is higher than 60% in the last minute, OCP will suggest that you increase the CPU resources.
Parameters
ocp.perf.sql.index-advisor-cpu-time-threshold: the threshold of the average CPU time of SQL statements for index recommendation. When the average CPU time of SQL statements is greater than this value, index recommendation is provided.ocp.perf.sql.index-advisor-elapsed-time-threshold: the threshold of the average response time of SQL statements for index recommendation. When the average response time of SQL statements is greater than this value, index recommendation is provided.
ParallelSQL diagnostics
The ParallelSQL feature enhances the analysis and diagnostic capabilities for OLAP SQL statements. ParallelSQL enables in-depth analysis on SQL statements that use the parallel framework of OceanBase Database for execution scheduling. It can collect time consumption statistics for SQL execution steps at the operator and scheduling levels. For scenarios involving the execution of complex SQL statements, such as distributed queries, parallel queries, multi-table joins, and analytical processing, this can help you find the slow operators or steps during SQL statement execution and thereby accelerate SQL optimization.
The following figure shows the framework of the ParallelSQL feature.
You can view the execution of each ParallelSQL operator on the OCP GUI to facilitate analysis in AP scenarios. The following figure shows the details.
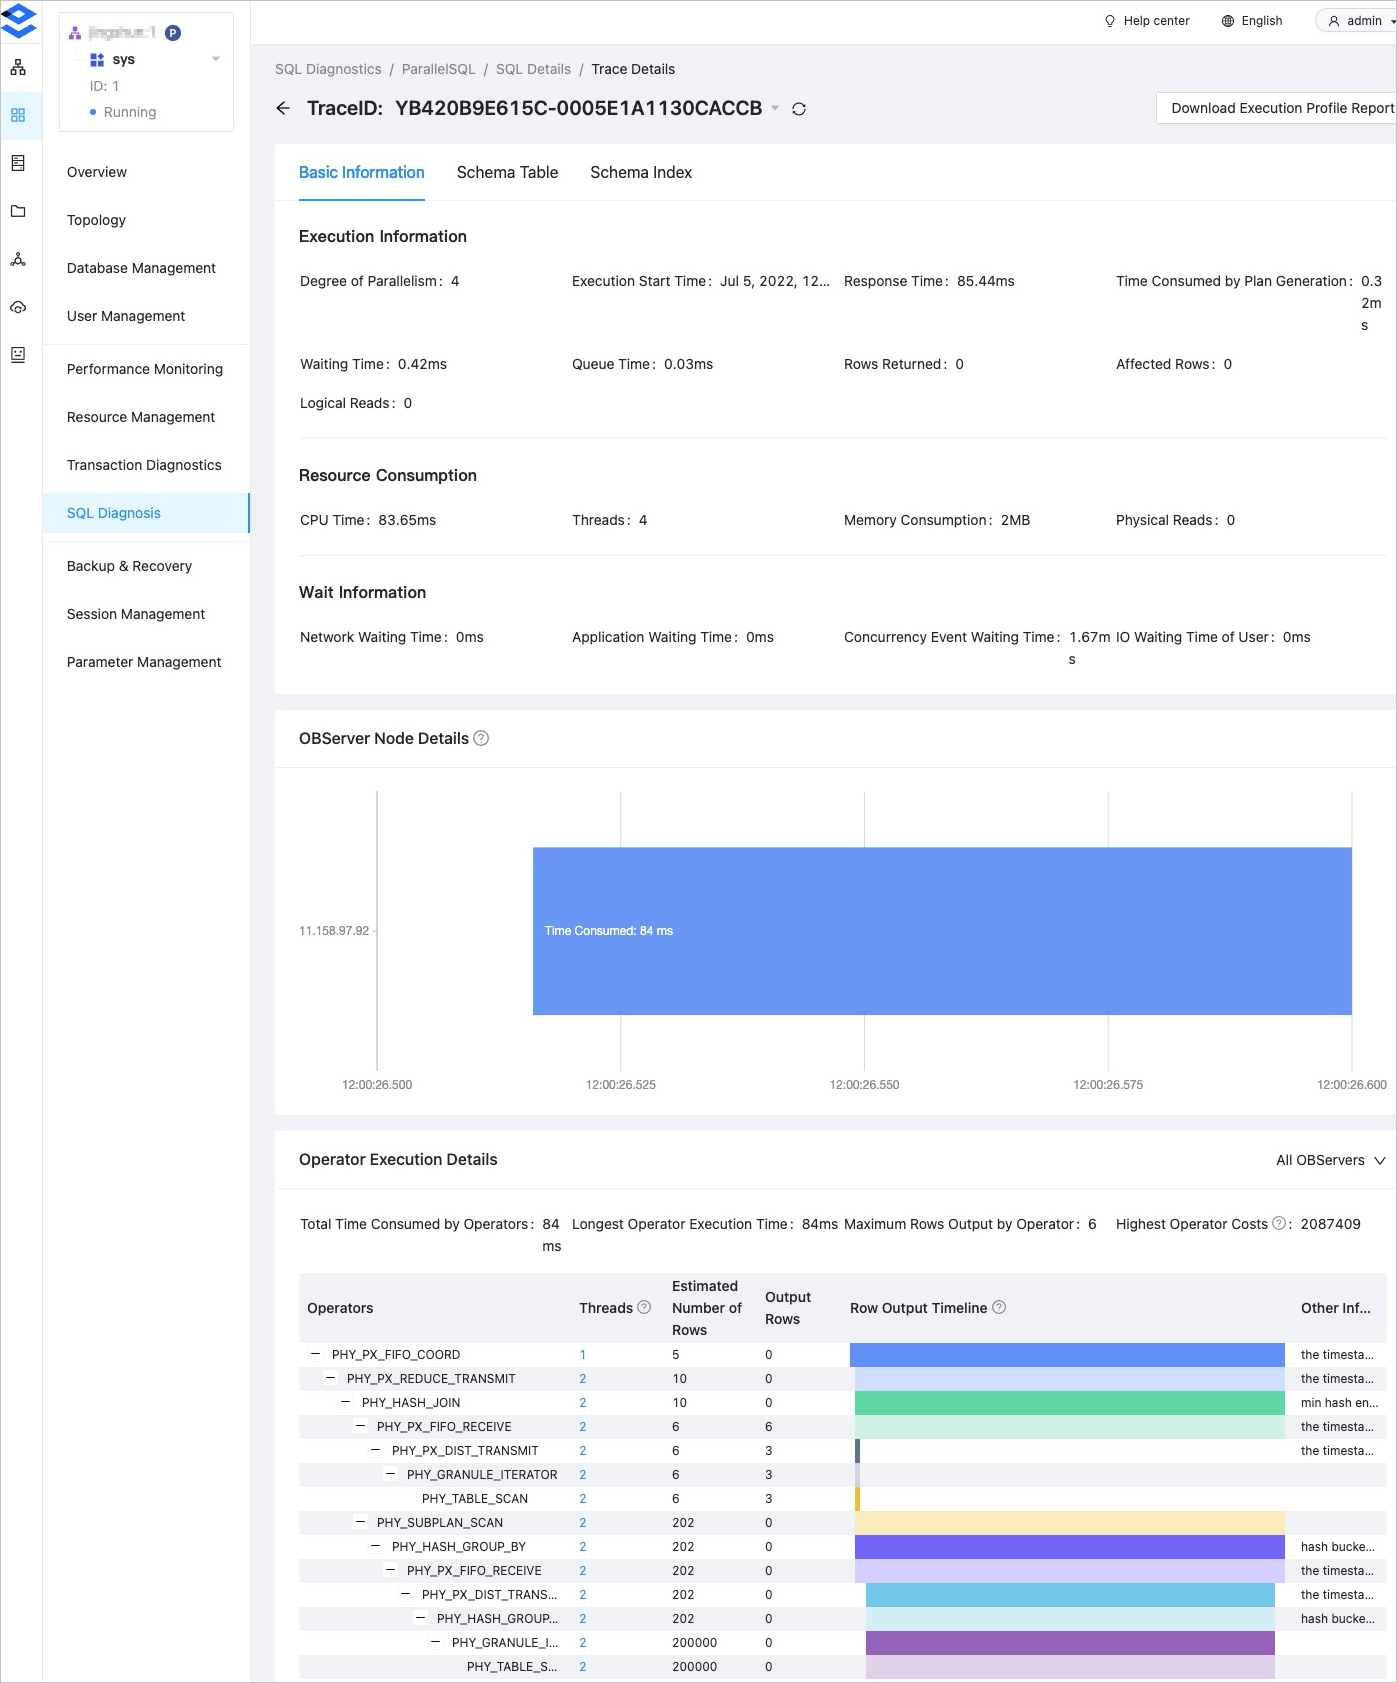
Table partition management
The following table describes the tables related to SQL diagnosis in MonitorDB, including their partitioning rules and involved modules.
Table name |
Partitioning rule |
Partition retention time |
Module involved |
Description |
|---|---|---|---|---|
| ob_hist_sql_audit_stat_0 | Daily | 2 days | TopSQL | Raw data for audit (30s) |
| ob_hist_sql_audit_stat_1 | Daily | 8 days | TopSQL | Level-1 summary data for audit (2 minutes) |
| ob_hist_sql_audit_stat_2 | Daily | 15 days | TopSQL | Level-2 summary data for audit (10 minutes) |
| ob_hist_sql_audit_sample | Daily | 7 days | SlowSQL, ParallelSQL, and transaction diagnostics | SQL execution sampling |
| ob_hist_sqltext | Daily | 30 days | TopSQL, SlowSQL, ParallelSQL, and transaction diagnostics | SQL text information |
| ob_hist_plan_cache_plan_stat_0 | Daily | 30 days | TopSQL, SlowSQL, and ParallelSQL | Summary information of historical execution plans |
| ob_hist_plan_cache_plan | Daily | 30 days | TopSQL, SlowSQL, and ParallelSQL | Metadata of historical execution plans |
| ob_hist_plan_cache_plan_explain | Daily | 30 days | TopSQL, SlowSQL, and ParallelSQL | Step table of historical execution plans |
| ob_hist_sql_plan_monitor | Daily | 15 days | ParallelSQL diagnostics | Execution information of parallel SQL operators |
| ob_hist_trans_stat_0 | Daily | 8 days | Transaction diagnostics | Transaction collection information |
| ocp_perf_sql_diagnosis | Daily | 30 days | Suspicious SQL and SQLTuningAdvisor | Diagnostic event record table |
| ocp_perf_sql_diagnosis_task | Daily | 30 days | Suspicious SQL and SQLTuningAdvisor | Diagnostic task execution record table |
| ob_hist_stat_server_progress | - | - | TopSQL | The progress of data collection from ob_hist_sql_audit_stat_0 to ob_hist_sql_audit_stat_0. |