


The monitoring feature of OceanBase Database depends on the monitoring feature of OceanBase Cloud Platform (OCP). OCP supports 24/7 monitoring and collection of metrics such as the performance, capacity, and running status of clusters, tenants, and nodes. OCP also displays the metrics in charts to help you understand the performance of OceanBase clusters, identify cluster exceptions, and receive alerts in real time. This ensures the stable and efficient operation of databases.
Monitoring
The monitoring feature of OceanBase Database covers the following parts:
Metric monitoring: monitors the OBServer status, ODP status, and host metrics.
SQL monitoring: monitors metrics of SQL statements and execution plans of OceanBase Database.
Cluster resource monitoring: monitors the metrics for resource usage of OceanBase clusters and OceanBase Database tenants.
Metric monitoring

In metric monitoring, the following metrics are collected:
Host metrics, including the CPU utilization, disk usage, I/O, and load of the host and services deployed on the host, such as OBServer and ODP.
ODP metrics, including information of requests, sessions, and transactions related to ODP.
OceanBase Database metrics in seconds or minutes, including performance metrics such as the resource status, and QTPS of the corresponding OBServers.
Metric monitoring depends on the ocp_exporter program of OCP-Agent on the host managed by OCP. The ocp_exporter program provides RESTful APIs to collect metrics in compliance with the Prometheus protocol and uses NodeExporter to collect the host metrics, ODPExporter to collect the ODP metrics, and OBCollector to collect the OBServer metrics. OCP aggregates and converts the collected metrics, and saves them in MonitorDB. Then, the compute engine queries the metrics from MonitorDB by using the Prometheus-based expression, computes the monitoring data, and returns the results to the client. Then, the client displays the computing results in monitoring charts.
SQL monitoring
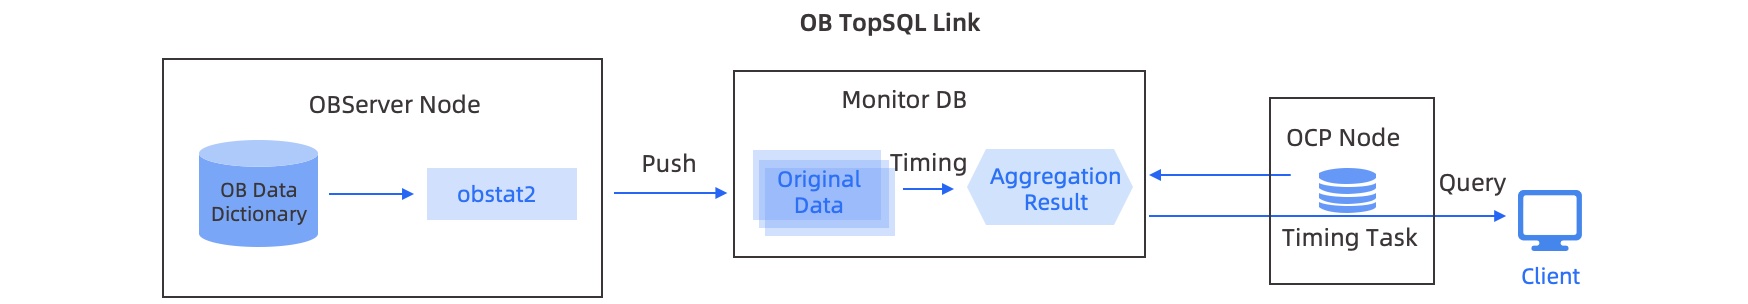
In SQL monitoring, metrics of SQL statements and SQL execution plans of each OceanBase cluster from the following data dictionaries are collected:
v$sql_audit: records the audit information for the execution of SQL statements.
v$plan_cache_plan_explain: records the information of each operator in the execution plans.
v$plan_cache_plan_stat: records the audit information of the execution plans.
Due to the huge amount of data of SQL statements and SQL execution plans, the obstat2 collection program is used to improve performance and reduce resource consumption. obstat2 is a high-performance and lightweight C++ program that can be configured based on the collection frequency. It collects the information of SQL statements and SQL execution plans from OceanBase data dictionaries by the specified collection cycle, locally aggregates and computes the collected information, and saves it to OCP MonitorDB. OCP runs background tasks to periodically aggregate and compute the data saved in MonitorDB. The SQL audit and SQL plan data at the minimum monitoring interval are aggregated into the results of a longer monitoring interval and saved. You can query the monitoring data on the performance monitoring page of OCP. If you specify a short time interval, OCP queries the original reported tables. If you specify a long time interval, OCP queries the aggregated tables.
Cluster resource monitoring
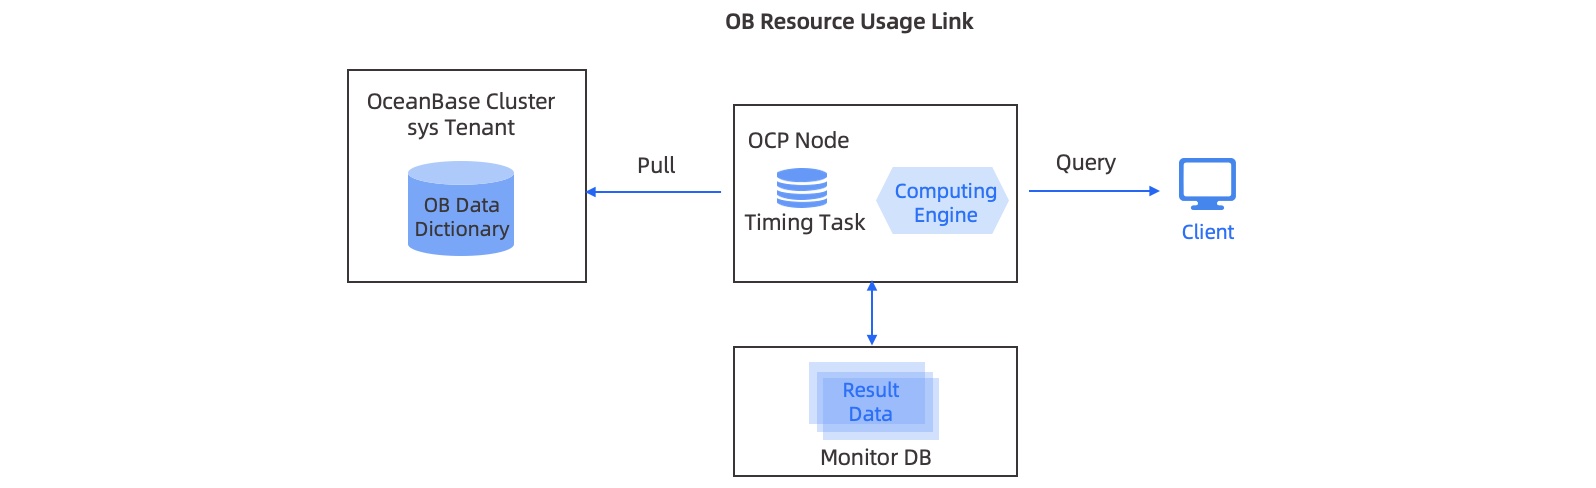 In cluster resource monitoring, metrics of resource usage of OceanBase clusters from the following sources are collected:
CPU metrics
- __all_virtual_server_stat: the total number of CPU cores and allocated cores.
Memory metrics
- __all_virtual_server_stat: the total memory size and occupied memory size.
Disk metrics
- __all_virtual_disk_stat: the total disk size and occupied disk size.
System event metrics
- __all_rootservice_event_history: the system events related to OceanBase clusters.
Partition replica metrics
__all_meta_table: the partition replica information table for OceanBase Database V1.4.x.
__all_virtual_meta_table: the information of all tenants of OceanBase Database V2.0.
__all_virtual_tenant_partition_meta_table: the partition group access information in OceanBase Database V2.2.x.
OCP schedules tasks to trigger cluster resource monitoring, which uses the SYS tenant of each OceanBase cluster to collect the usage information of the CPU, memory, disks, and partition replicas on OBServers by cluster, tenant, database, and table. The collected data is saved to MonitorDB. When you initiate a query from the client, OceanBase Cloud Platform (OCP) collects statistics by cluster, tenant, database, and table, and returns the statistics to the client.
Alerts
The alerting feature of OceanBase Database depends on OCP alerts that inform you of the risks and faults of hosts and databases during their operation. When a database or a database host is about to fail or is faulty, the OCP built-in alert items are triggered to send alerts to the subscribers by using the alert channels. The alert feature of OCP involves alert configuration, alert detection, alert aggregation, and alert subscription.
Alert configuration
OCP provides 60 built-in alert items. Each alert item describes the basic alert information and the alert detection rules. The basic alert information includes the alert name, alert level, alert overview, and alert details.
The alerts are divided into five levels based on the risk severity. The alert levels from high to low are Stopped, Critical, Warning, Caution, and Reminder. When an alert is triggered, it generates template variables that can be configured in the alert overview and details templates to provide necessary context. Alert detection rules are based on the metric expression and include detection duration, detection cycle, elimination cycle, and detection expression configuration.
The built-in alert items cover database resources and events, host resources, and OCP events. These alert items involve alerts against exceptions in the following aspects: the usage of database resources, such CPU, memory, MemStore, and disk space, system events such as compaction timeouts and transaction suspension, the usage of host resources such as network bandwidth and disk space, and OCP events such as events related to the monitoring API status and the synchronization between the MetaDB and an OceanBase cluster.
Alert detection
Alert detection is the process of detecting the built-in alert items and triggering the alerts. OCP supports the detection based on metric expressions and the logical detection of scheduled tasks. An alert is generated after an alert event is detected. However, the notification of the alert event depends on the alert aggregation logic, which can be configured to limit the notification of alerts and avoid alert storms.
For alerts based on metric expressions, the monitoring data can be aggregated by using monitoring APIs to match the query results with the alert thresholds. An alert event is triggered if the result exceeds the specified alert threshold.
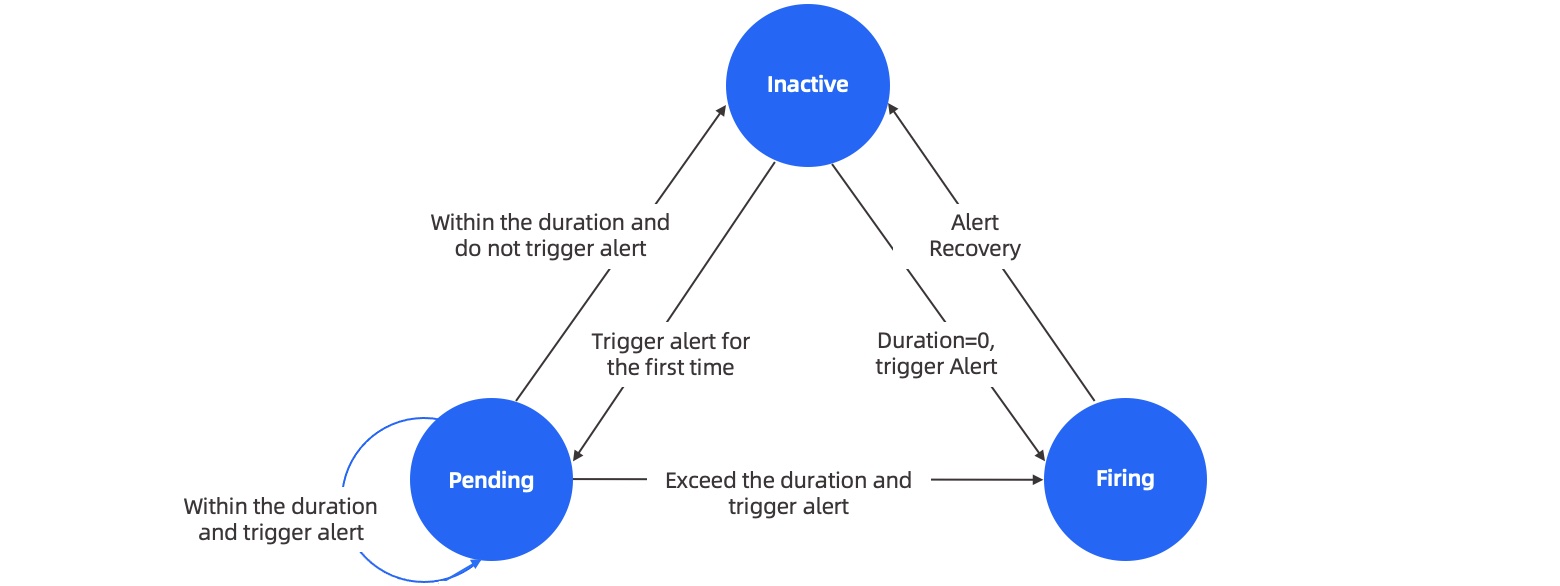
The preceding figure shows the alert status transition during the detection of the alerts based on metric expressions. The duration refers to the detection duration of an alert. An alert event is triggered when alerts are repeatedly triggered within the duration. The duration is used for exception tolerance. This means that an occasional exception does not trigger an alert. An alert is triggered only when the exception persists.
The scheduled logical detection applies to some complex scenarios in which detection scripts are required. During the scheduled logical detection, the alert API is called to generate alerts, such as OceanBase Database log alerts and OceanBase Migration Service (OMS) alerts. This detection method applies to event-based alerts of systems other than OCP.
Alert aggregation
Alert aggregation is a mechanism that is designed to avoid alert storms. It aggregates alerts into a small number of aggregated messages based on the predefined rules.
The following example shows a deep-first matching rule for alert aggregation. The OceanBase Database log alerts (ob_log_alarm) are aggregated in three dimensions: alarm_type (alert item), ob_error_code (log error code), and obregion (OceanBase cluster name).
aggregate:

  # By default, alerts at the root layer are aggregated by alert type (alarm_type).
  match: {}
  group_by:
    - "alarm_type"
  aggregate_wait_seconds: 10
  aggregate_interval_seconds: 60
  repeat_interval_seconds: 3600

  aggregates:

    # Aggregate OceanBase Database alerts by alert type and OceanBase cluster.
    - match:
        app: "OB"
      group_by:
        - "alarm_type"
        - "obregion"
      aggregate_wait_seconds: 10
      aggregate_interval_seconds: 60
      repeat_interval_seconds: 3600

      aggregates:

        # Aggregate OceanBase Database log alerts by alert type, log error code, and OceanBase cluster.
        - match:
            alarm_type: "ob_log_alarm"
          group_by:
            - "alarm_type"
            - "ob_error_code"
            - "obregion"
          aggregate_wait_seconds: 10
          aggregate_interval_seconds: 60
          repeat_interval_seconds: 3600
aggregate_wait_seconds specifies the wait time before the first aggregated alert is generated, in seconds. Alerts that are generated in the same dimension within this period are aggregated into one alert message.
aggregate_interval_seconds specifies the aggregation cycle for alerts in the same dimension, in seconds. This parameter specifies the interval between two aggregated alert messages.
repeat_interval_seconds specifies the sending cycle of the same alert, in seconds. Alerts with the same ID are defined as the same alert. The alert ID does not increase if the alert is not cleared. The same alert is aggregated only in the next sending cycle.
Alert subscription
The alert subscription feature allows for easy sending of alert messages to different users.
OCP divides alert items into the following six alert groups that you can subscribe to:
ocp: alert items related to OCP.
dba: alert items related to OceanBase Database.
info: info-level alert items, also known as operational alert items.
oms: alert items related to OMS applications.
backup: alert items related to data backup and recovery.
dev: alert items related to O&M.
You can subscribe to alerts by cluster or by alert level. Alerts are sent to different alerting channels. An alert channel defines how to send an alert. OCP supports sending alerts by using Bash scripts, Python scripts, and HTTP APIs. You can also set throttling strategies for the channels to limit the sending volume.