


OCP supports the 24/7 collection of monitoring metrics such as the performance, capacity, and running status of clusters, tenants, and nodes. OCP also displays the metrics in charts to help you understand the performance of OceanBase clusters, identify cluster exceptions, and receive alerts in real time, thus ensuring the stable and efficient operation of your OceanBase database.
Version information
The monitoring and alert features vary based on the OCP version. This topic uses OCP V3.3.0 as an example.
Monitoring
OCP provides various types of monitoring metrics and the corresponding monitoring links.
Each link collects a specific type of monitoring data.
General monitoring metric link: This link provides API query interfaces based on the Prometheus standard, and collects the status metrics of OBServer nodes, OceanBase Database Proxy (ODP), and hosts, as well as some other OBServer metrics.
OceanBase SQL link: This link collects metrics on SQL statements and execution plans of OceanBase Database and performs aggregation computation on these metrics.
OceanBase cluster resource monitoring link: This link collects the metrics for resource usage of OceanBase clusters and OceanBase Database tenants.
General monitoring metric link
The following figure shows the architecture of the general monitoring metric link.

The monitoring of the metric link depends on the ocp_exporter program of OCP Agent on the host managed by OCP. The ocp_exporter program provides a set of RESTful services to collect monitoring metrics. The APIs provide monitoring metrics based on the Prometheus protocol. OCP aggregates and converts the collected metrics, and saves them in MonitorDB. The compute engine queries the metrics from MonitorDB by using the Prometheus-based expression, computes the monitoring data, and returns the results to the client. Then, the client displays the computing results in monitoring charts.
Lifecycle
This monitoring link is triggered by a scheduled task on OCP. The monitoring link starts to collect data right after the OCP Agent is installed. This link collects data based on services deployed on the host. By default, the monitoring link collects host metrics after the OCP Agent is installed. If ODP or OBServer is deployed, the monitoring link starts to collect the corresponding metrics.
Data source
Host metrics: the CPU utilization, disk usage, I/O, and load of the host and services deployed on the host, such as OBServer and ODP.
ODP metrics: the information on requests, sessions, and transactions related to ODP.
Second/minute-level metrics of OceanBase Database: OCP connects to the sys tenant on the local OBServer node with the built-in user ocp_monitor of OceanBase Database, queries the related data dictionaries, and then returns the query results as metrics. Basic metrics of the current OBServer node are collected. The basic metrics include, but are not limited to, the performance monitoring statistics (QPS, QPS_RT, and active sessions) of clusters and tenants, transaction monitoring statistics (transaction log volume and lock wait statistics), and storage and cache statistics.
Data format variables
The link provides monitoring data in the Prometheus format as follows:
io_util{app="HOST",dev="XXX",device="sdl",env_type="host",is_ob_volume="",ob_cluster_id="1001",ob_cluster_name="obcluster",ob_device="",obproxy_cluster="",obproxy_cluster_id="0",obregion="obcluster",obzone="zone1",svr_ip="XXX.XXX.XXX.XXX"} 0
Parameters:
io_util: a monitoring metric.
Content enclosed in {}: a monitoring dimension or label.
0: a metric value.
Storage format
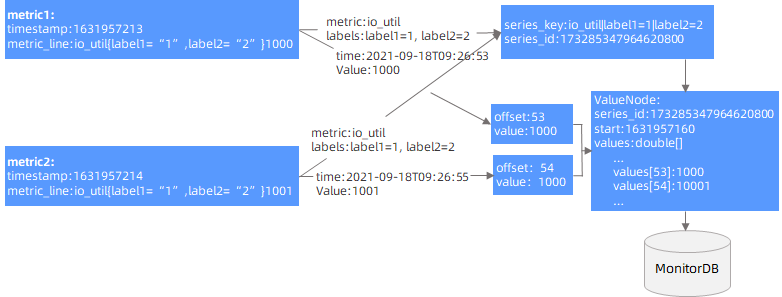
OCP encapsulates the collected monitoring data in Prometheus format, maps Metrics + Labels to SeriesKeys, assigns a unique SeriesId to each SeriesKey, and uses the SeriesId to associate the monitoring data (timestamp + value). The data is cached when saved. A scheduled task aggregates the cached data at regular intervals, and then stores it in MonitorDB after encryption.
As shown in the following figure, OCP aggregates data of the same SeriesId by minute. It uses the offset of the current minute as the index bit of the aggregated data, caches the data within a minute into a ValueNode, and stores it in the cache. Then, OCP performs scheduled tasks in the background to periodically save the ValueNode data in the cache to MonitorDB.
Query method
The OCP metrics can be queried by using Prometheus expressions. OCP queries the stored monitoring data based on the expressions, computes the data based on the query criteria, and returns data in JSON format. The Web console then renders and displays the monitoring charts based on the queried data. Sample query expression:
sum(io_util{label1="1",label2="2"}) by (label1,label2)
OceanBase SQL link
The following figure shows the architecture of the Oceanbase SQL link.

This link collects performance-related data from data dictionaries of OceanBase Database, performs summary computation, and saves the data to MonitorDB. The performance-related data can be used for performance analysis and SQL diagnosis, such as TopSQL statements, SlowSQL statements, suspicious SQL statements, and performance reports.
Lifecycle
This link collects monitoring data after OBServer is deployed on the host.
Data source
This link collects metrics of SQL statements and SQL execution plans of each OceanBase cluster from the following data dictionaries of OceanBase Database:
v$sql_audit: records the audit information for the execution of SQL statements.v$plan_cache_plan_explain: records the information of each operator in the execution plans.v$plan_cache_plan_stat: records the audit information of the execution plans.
Data format
The following SQL data is returned:
collect_time: 1630627200000000
ob_cluster_id: 1
 cluster_name: c1
 ob_tenant_id: 1
  tenant_name: sys
 ob_server_id: 1
     ob_db_id: 1099511627777
      db_name: oceanbase
   ob_user_id: 1099511627777
    user_name: root
       sql_id: 00C5C17B73612C7BC030ED8A8174E7CF
     sql_text: select 1 from __all_virtual_server_stat where svr_port=2881
  create_time: 2021-09-03 17:40:40
Query method
This link provides APIs to allow you to query SQL performance data from multiple dimensions, such as suspicious SQL statements, TopSQL statements, and SlowSQL statements.

Oceanbase cluster resource monitoring link
The following figure shows the architecture of the Oceanbase cluster resource monitoring link.
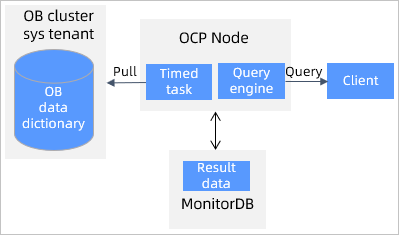
OCP schedules tasks to trigger cluster resource monitoring, which uses the sys tenant of each OceanBase cluster to collect the usage information of the CPU, memory, disks, and partition replicas on OBServer nodes by cluster, tenant, database, and table, as well as the major compaction information of partitions and cluster snapshot information. The collected data is saved to MonitorDB. When you initiate a query from the client, OCP collects statistics by cluster, tenant, database, and table, and returns the statistics to the client.
Lifecycle
Monitoring data collection starts after the OCP cluster is created.
Data source
CPU information
__all_virtual_server_stat: the total number of CPU cores and allocated cores.
Memory information
__all_virtual_server_stat: the total memory size and occupied memory size.
Disk information
__all_virtual_disk_stat: the total disk size and occupied disk size.
System event information
__all_rootservice_event_history: the system events related to OceanBase clusters.
Partition replica information
__all_meta_table: the partition replica information table for OceanBase Database V1.4.x.__all_virtual_meta_table: the information of all tenants of OceanBase Database V2.0.x__all_virtual_tenant_partition_meta_table: the partition group access information in OceanBase Database V2.2.x.
Data format
This link queries the major compaction information of partitions from internal tables of an OceanBase database based on the configuration and saves the data to the corresponding table in MonitorDB.
Query method
This link uses APIs to query the monitoring data and displays the data in OCP charts, Examples:

Alert
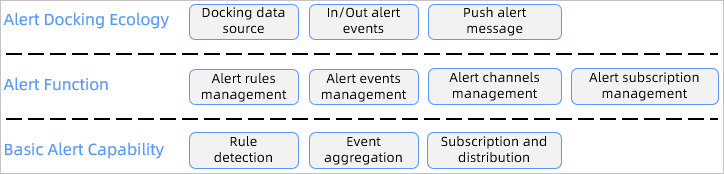
The alert feature is a basic O&M capability provided by OCP. OCP notifies users of O&M operations and monitoring events in the form of alert messages. The OCP alert feature provides the following capabilities:
Integrating monitoring data and SQL data, and generating alerts after detecting exceptions based on the built-in alert rules and the exception detection engine
Managing alert events, including masking and aggregating events in different dimensions to eventually generate alert messages
Enabling alert message subscription and distribution, sending alert messages to specified owners in various dimensions, and providing throttling policies
The following figure shows the architecture of the OCP alert feature:
Alert interworking ecosystem
Data sources: The alert module is currently connected to OCP data sources, including the metric-type monitoring data and SQL audit data. To integrate an external data source into the OCP alert feature, you must connect the external data source to the OCP data source and ensure that the external data is compatible with the Prometheus protocol. Metric data is the time-series data monitored by OCP and is compatible with Prometheus protocol and some PromQL specifications. SQL audit data is structured data converted into time-series data for alert detection.
Outbound alert events: The alert module provides an OpenAPI that allows external systems directly receive corresponding alerts. For example, you can perform intelligent diagnosis and root cause analysis based on all alerts.
Inbound alert events: The alert module can also receive alert events generated by external systems for multi-dimensional alert management and alert notification. In this case, you do not need to connect to external data sources, which simplifies the interconnection process.
Push alert messages: You can interconnect the alert message module with external systems for the interworking of an external ecosystem.
Alert
Manage alert rules
The alert feature allows you to set alert rules for metrics based on multiple dimensions. Take the following alert rule as an example:
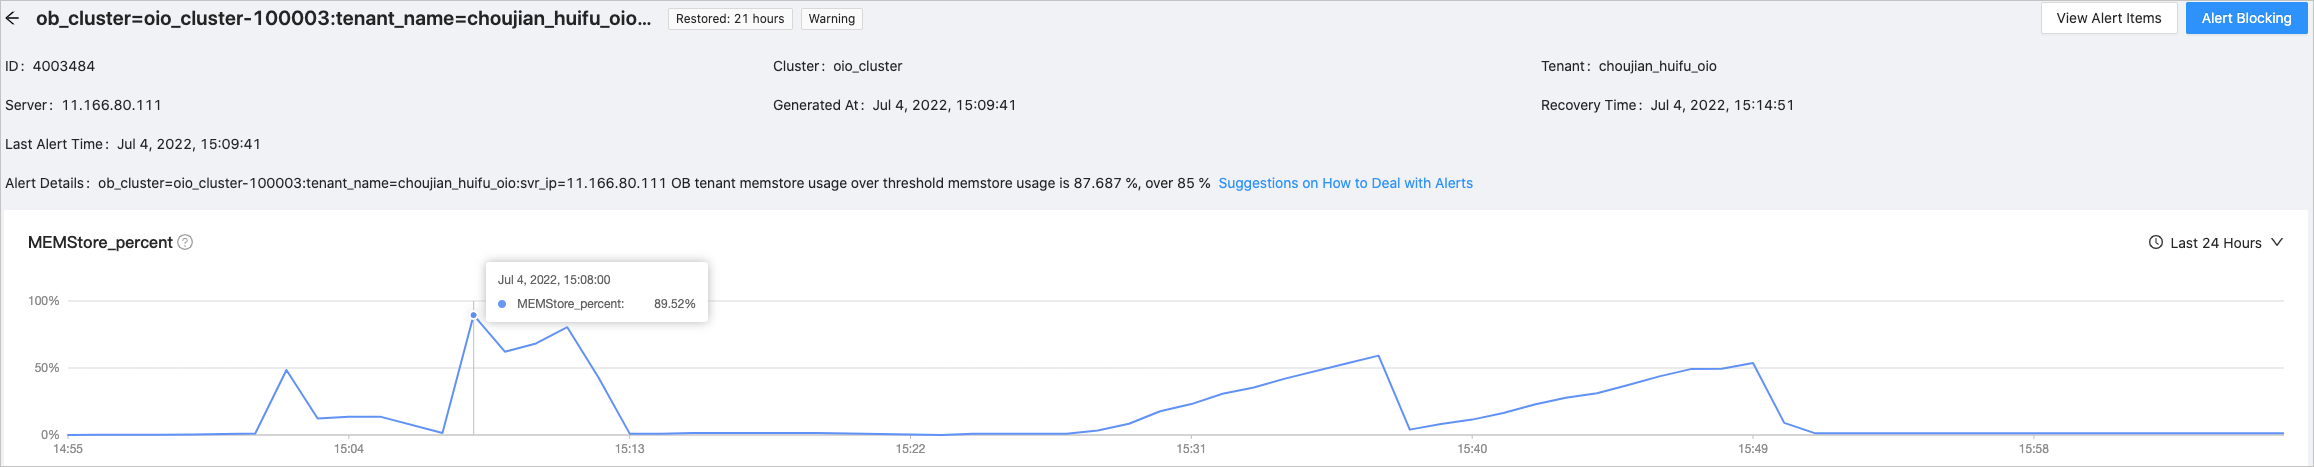
Generate an alert if the MemStore usage of the sys tenant and the oracle_1 tenant of the obcluster cluster continuously exceeds the threshold for more than two minutes. Generate a critical alert if the usage exceeds 85% and a stopped alert if the usage exceeds 95%. Examples:
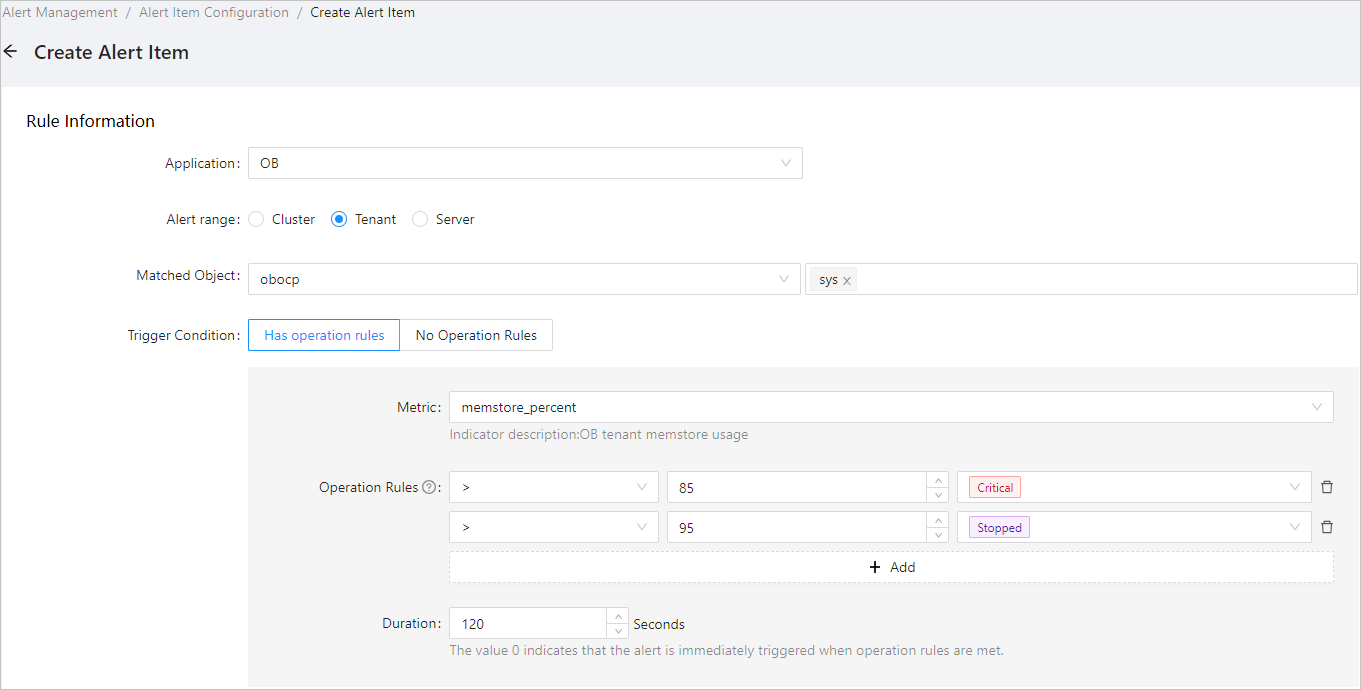
The following example shows how to configure the corresponding alert expression:
- alarm_type: tenant_memstore_percent_over_threshold
  alarm_metric: ob_tenant_host_memstore_percent
  expression: memstore_percent > 85
  level: 3
  duration_seconds: 120
  evaluation_interval_seconds: 60
  is_default: 1
- alarm_type: tenant_memstore_percent_over_threshold
  alarm_metric: ob_tenant_host_memstore_percent
  expression: memstore_percent > 95
  level: 2
  duration_seconds: 120
  evaluation_interval_seconds: 60
  is_default: 1
You can print the alert generation context in the alert information to facilitate problem locating. The following example shows an alert details template:
${alarm_target} ${alarm_name} MemStore usage ${value_shown}, exceeding the threshold of ${alarm_threshold} %
The following example shows how an alert message looks:
MemStore usage of the OceanBase Database tenant ob_cluster=obcluster-1631964370:tenant_name=oracle_1:svr_ip=XXX.XXX.XXX.XXX exceeds the threshold. The MemStore usage is 90.486%, exceeding the threshold of 85%.
${} is an alert variable. The alert variable is essentially the label of time-series data throughout the alert process.
For more information about alert variables, see the "OCP alert template variables" topic in OCP Appendix.
To facilitate the monitoring of data changes when an alert is triggered, monitoring charts are displayed on the alert details page. The following figure shows the details.
Alert event management
The alert module provides the following alert event management features: alert masking and log alert keyword disabling. For example, you can temporarily or periodically block expected alerts, and disable log alerts by specific keywords. After the corresponding keywords are disabled, alert events are still generated, but the corresponding alert messages are not generated.
The alert information is forwarded in the format of time-series labels. The following takes a long transaction alert event as example:
{
  "alarm_active_at": "2022-05-17T12:24:03Z",
"alarm_description": "Cluster: obcluster, tenant: oracle_1 has suspended XA transactions. Session ID: 3221684673, transaction ID: {hash:7946119440783364385, inc:73479440,addr:\"192.168.1.1:2882\",t:1651733840767037}, transaction create time: 2022-05-05T14:57:20.770+08:00, transaction duration: ${value_shown}.",
"alarm_description_1": "Cluster: obcluster, tenant: oracle_1 has a suspended XA transaction. Session ID: 3221684673, transaction ID: {hash:7946119440783364385, inc:73479440,addr:\"192.168.1.1:2882\",t:1651733840767037}, transaction create time: 2022-05-05T14:57:20.770+08:00, transaction duration: ${value_shown}.",
  "alarm_description_2": "",
  "alarm_description_3": "",
  "alarm_evaluation_interval": "60",
  "alarm_is_build_in_rule": "false",
  "alarm_level": "3",
  "alarm_name": "Long transactions on tenant",
  "alarm_name_1": "Long transactions on tenant",
  "alarm_resolved_at": "2022-05-18T08:27:32Z",
  "alarm_scope": "ObTenant",
  "alarm_status": "Inactive",
  "alarm_summary": "ob_cluster=obcluster-1631964370:tenant_name=oracle_1 has long transactions",
  "alarm_summary_1": "ob_cluster=obcluster-1631964370:tenant_name=oracle_1 has long transactions",
  "alarm_summary_2": "",
  "alarm_summary_3": "",
  "alarm_target": "ob_cluster=obcluster-1631964370:tenant_name=oracle_1",
  "alarm_type": "tenant_long_trans",
  "alarm_updated_at": "2022-05-18T08:22:22Z",
  "app": "OB",
  "app_type": "OB",
  "host_ip": "192.168.1.1",
  "is_xa_trans": "1",
  "message_type": "Recovery",
  "ob_cluster": "obcluster",
  "ob_cluster_id": "1631964370",
  "ob_cluster_name": "obcluster",
  "ob_cpu_percent_alarm_threshold": "-10",
  "ob_cpu_percent_value": "0",
  "ob_cpu_percent_value_en_us": "0 %",
  "ob_cpu_percent_value_zh_cn": "0 %",
  "ob_cpu_percent_value_zh_tw": "0 %",
  "ob_tenant": "oracle_1",
  "ob_tenant_id": "1003",
  "obregion": "obcluster",
  "session_id": "3221684673",
  "sql_alarm_type": "trans_stat",
  "svr_ip": "192.168.1.1",
  "tenant_id": "1003",
  "tenant_name": "oracle_1",
  "trans_create_time": "2022-05-05T14:57:20.770+08:00",
  "trans_hash": "{hash:7946119440783364385, inc:73479440, addr:\"192.168.1.1:2882\", t:1651733840767037}",
  "trans_max_duration_seconds": "1128254.55",
  "trans_state": "pending",
  "trans_type": "xa",
  "xa_trans_max_duration_seconds": "1128254.55",
  "xa_trans_max_duration_seconds_alarm_threshold": "0",
  "xa_trans_max_duration_seconds_value": "1128254.55",
  "xa_trans_max_duration_seconds_value_en_us": "13 days 1 hours 24 mins 14.55 secs",
  "xa_trans_max_duration_seconds_value_zh_cn": "13 days 1 hour 24 mins 14.55 secs",
  "xa_trans_max_duration_seconds_value_zh_tw": "13 days 1 hour 24 mins 14.55 secs"
}
You can obtain the alert variables throughout the alert process. Note that the alert variable varies based on the alert. General processing allows you to obtain only general variables.
Manage alert channels
The alert channel feature supports the following operations:
Aggregating alert events by dimension and generating alert messages.
Sending alert messages, such as sending a message to a DingTalk group.
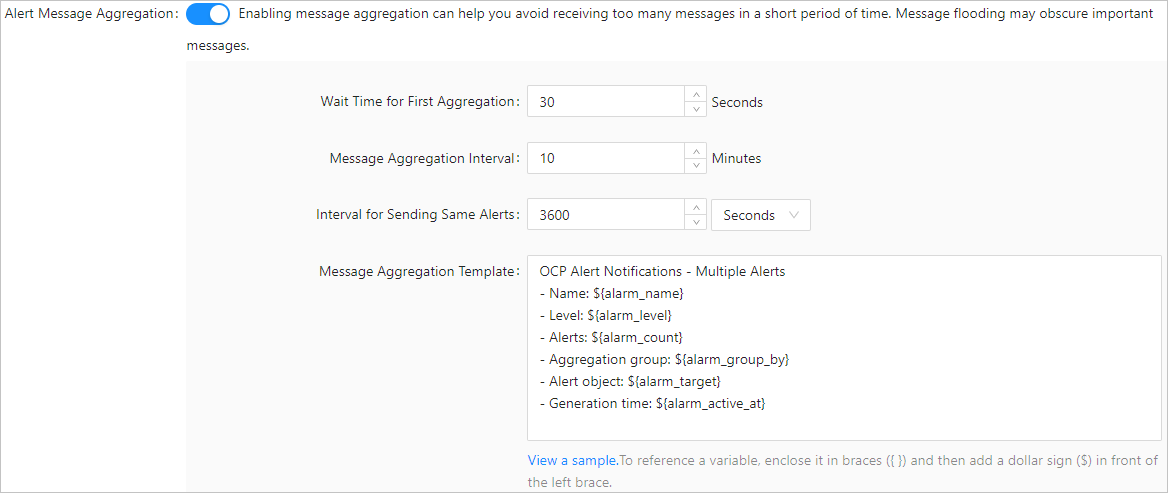
Aggregate alerts
You can aggregate similar alert events into one alert message. When system faults occur on a large scale (for example, the CPU utilization on 500 servers exceeds the alert threshold) similar alert events are generated. You can enable the system to send only one alert message for similar alert events generated in the specified period to prevent alert storms.
For example, if alert events of the same instance have the same unique key (alarm_target) and a primary key (id) in the OCP metadata table, and they share the same alert time ID, they are considered events of the same type. Alert events are in time series and persist for a period. During this period, alerts of the same instance are recorded only once, distinguished by primary keys.
Example:
After you enable alert message aggregation, alert events of the same alert item are aggregated. You can configure an aggregated alert message template, which can be referenced as the ${message} variable in the alert sending logic.
Examples:
 Send alerts:
OCP provides two alert message sending methods:
To send simple alert message content, you can use the HTTP channel, which requires the sending address and content only. This method allows simple reference of variables provided by the alert and supports content assembly in a custom format.
To send data signature and custom message formats and content, you must use the script channel, which can be configured with bash or python scripts.
Alert subscription management
You can subscribe to alerts based on alert rule groups or other dimensions, such as the cluster, alert type, and alert severity. OCP sends alerts in different dimensions to different channels based on the subscription configuration.
For example, you can enable OCP to make a call when an alert at the stopped level is triggered for an OceanBase database, send an SMS message when an alert at the critical level is triggered, and send a message to the DingTalk group when an alert of other levels is triggered.
You can configure the corresponding alert notification method in the alert channel. To implement these features, you must connect to the corresponding systems, The following figure shows the details.
Basic alert capabilities
The alert feature depends on basic alert capabilities, including rule detection, event aggregation, and subscription and distribution.
Rule detection
The alert feature provides a built-in detection engine based on time-series data. During each system task polling, the system checks the data against the alert rules concurrently by retrieving real-time monitoring data from the data source, sorting the data by time, detecting abnormal data, and recording the data status. When the data status meets an alert rule, an alert event is generated and recorded. The alert event data is then forwarded to the next step. The rule detection is strict. When the value of a metric reaches the threshold at a specific point in time, the system considers that the alert rule is triggered. To monitor metrics prone to hopping, you can configure the alert detection duration to increase tolerance. An alert is generated only when the rule is triggered for a continued period.
Event aggregation
All events generated upon rule detection or pushed by external systems are sent to the event aggregation process. The aggregation rules are provided with the system and do not support customization. You can aggregate alerts only by dimensions such as alert items, OceanBase clusters, and alert levels.
Subscription and distribution
Basic alert capabilities are essentially the processing of time-series data, including label matching and variable filling and aggregation. Rule-based subscription converts the data into labels for matching. After a subscription channel is matched, alert messages are sent based on the alert channel requirements. You can match the search results, resend alert messages, or restrict the messages to be sent.