


Introduction
OceanBase Active Session History Report (ASH Report) provides analysis reports on active database sessions. You can use ASH Report to obtain information about historical OceanBase Database sessions. Such information can help you locate instantaneous abnormal events. It is difficult to get the execution details of the instantaneous jitters from the performance reports, and such information can easily be overwritten by hourly snapshot information of the performance reports. Therefore, ASH Report came into being to provide the session-level diagnostic information that is required to solve this problem.
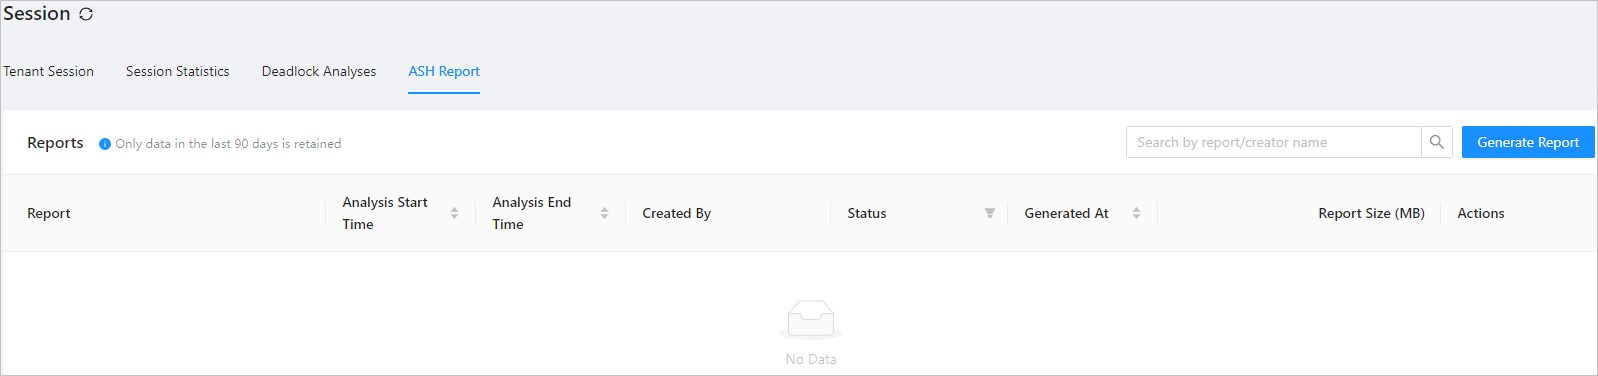
ASH report provides diagnostic capabilities at the tenant level, The following figure shows the details.
Version information
The ASH report feature varies based on the OCP version. This topic uses OCP V3.3.0 as an example.
Implementation principle
The following figure shows the framework for generating an ASH report.

The whole process can be divided into two steps: data collection and report generation.
Data collection: OCP has an ocp_monagent process running on each server in the OceanBase cluster that it manages. The ocp_monagent process collects the required monitoring data based on the specified strategy and stores the data in the MonitorDB of OCP.
Report generation: OCP generates reports when you enter the relevant information in the ASH module of OCP. Implementation: OCP splits a report task into multiple subtasks based on the task module for concurrent execution. Different subtasks exchange information through CONTEXT. The final report content is saved in the OSS bucket of OCP for users to view.
OceanBase Database records all waiting events for the SQL statements that have been executed in the session of each user in the v$session_event view, including the wait event ID, the number of waits, and the accumulated wait time. The ocp_monagent collection process collects data from v$session_event at a fixed frequency and stores incremental data.
After you specify a period on the ASH page in OCP, OCP analyzes the database load and top SQL execution statistics during this period, including the top waiting events, top SQL types, SQL statements sorted by waiting time proportion, sessions sorted by waiting time, and activity time slices.
Top waiting events: You can learn about the events that took the largest wait time proportion in the period and identify the possible bottlenecks in system operation.
Top SQL command types: You can learn about the application scenarios of your services, determine whether the service scenario has more writing or reading services, and identify the proportion of response time and the average number of active sessions for each command.
SQL statements sorted by wait time proportion: You can identify the SQL statements that have the largest wait time proportion and the SQL statement execution frequency in a period so that you can optimize these SQL statements.
Sessions sorted by waiting time: The waiting events are sorted in the session dimension. In addition, the Top waiting events are listed, so that you can learn about the operation conditions of your business and optimize the business where bottlenecks occur.
Activity time slices: The ASH report divides the period that you specified into finer-grained time windows and analyzes the statistics for each time window to help you identify the specific time window in which the exception occurred and the specific waiting events that caused the exception. This feature helps O&M engineers identify the cause of a problem more quickly.
The following figure shows an ASH report.
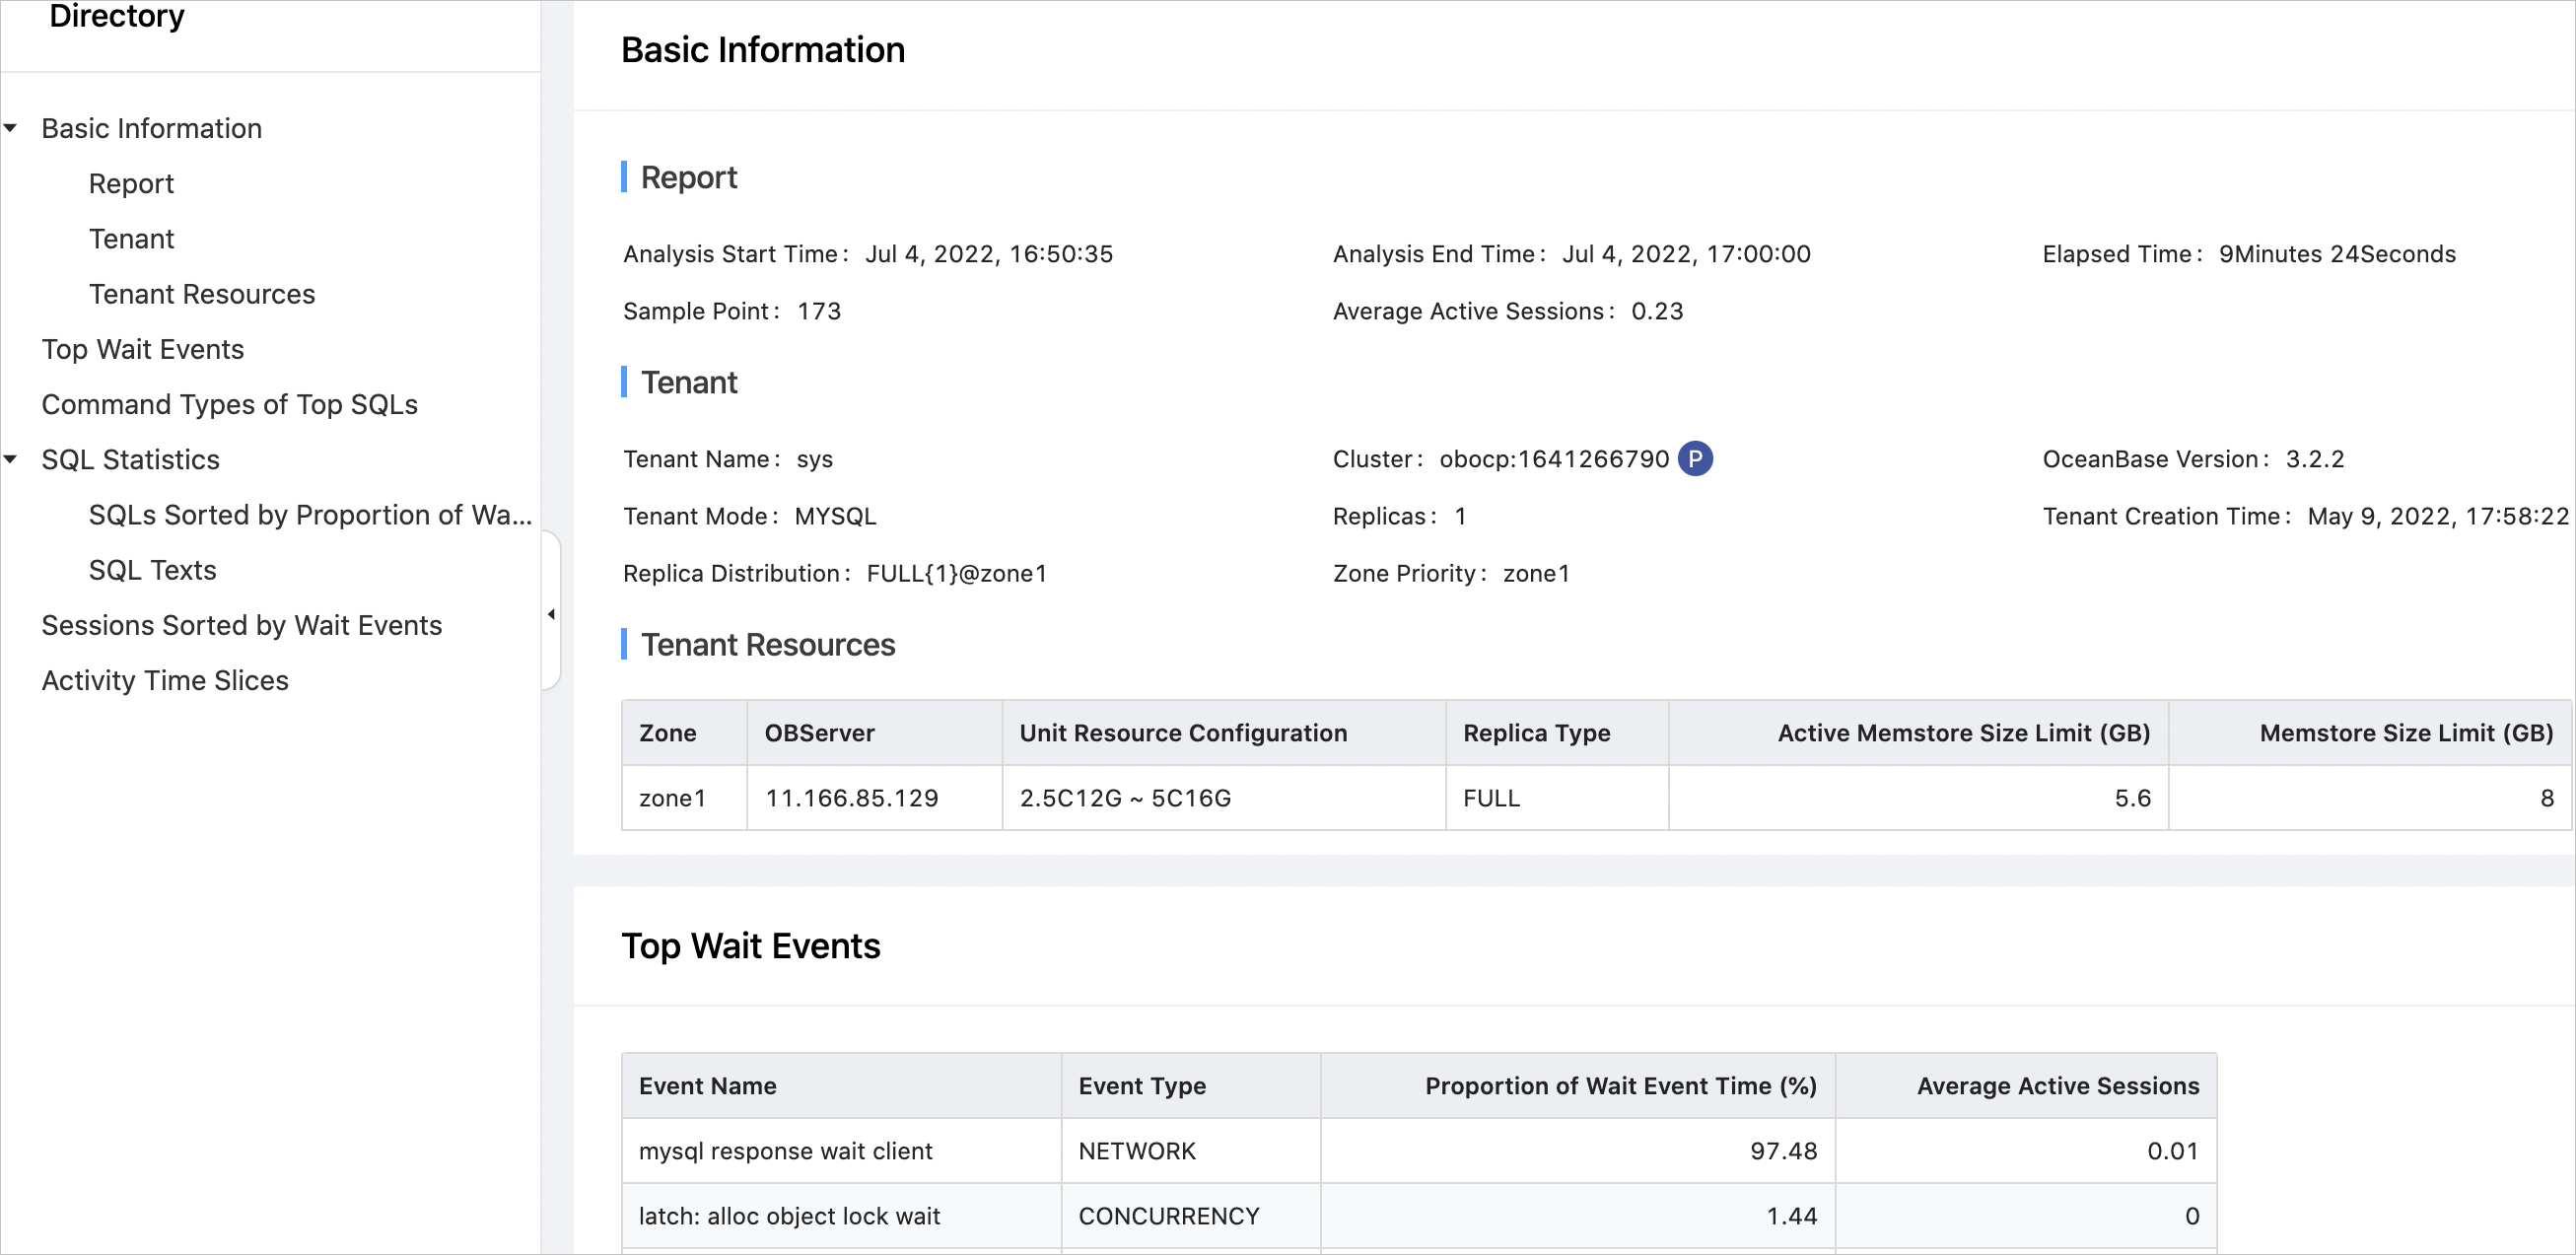
The busyness of a database is expressed as the average number of active sessions. A higher average number of active sessions indicates a busier database and a longer DBTime that the database spends on handling database requests.
Partition management
Table name |
Partitioning rule |
Partition retention time |
Module |
|---|---|---|---|
| ob_hist_active_session_stat_0 | Daily | 30 days | ASH report |
View performance data by using views
Views |
Description |
|---|---|
| v$session_event,gv$session_event | Displays the information about wait events in each session. ocp_monagent periodically collects information from the view and records incremental wait event information to the ob_hist_active_session_stat_0 table of MonitorDB. OCP uses it as the base data and associates it with the TopSQL data to generate the final ASH report. |