


OceanBase Cloud Platform (OCP) provides SQL diagnostics features for suspicious SQL statements, top SQL statements, slow SQL statements, and parallel SQL statements.
Background information
Definitions of suspicious SQL statements, top SQL statements, slow SQL statements, and parallel SQL statements:
Suspicious SQL statements: SQL statements that are diagnosed to meet the diagnostic criteria based on the diagnostic type, SQL statement, execution history, and table structure.
Top SQL statements: SQL statements that take the longest time to execute.
The TopSQL feature sorts different types of SQL statements based on their execution time. The TopSQL query result reflects the performance of an OceanBase cluster, OceanBase Database tenant, or OBServer to execute different types of SQL statements in a period. You can locate poor-performing SQL statements in the database by using this feature.
Slow SQL statements: SQL statements whose execution time exceeds the slow-query threshold. You can use the SlowSQL diagnostics feature to identify risky statements and avoid risks.
The SlowSQL query result usually reflects the performance changes of an SQL statement in different periods. You can use the SlowSQL feature to locate the causes of the SQL performance changes.
Parallel SQL statements: A parallel SQL statement is an SQL statement configured with a degree of parallelism in a single execution. You can use ParallelSQL diagnostics to identify SQL statements that do not meet the expectation in terms of analytical processing performance.
Perform suspicious SQL diagnostics
To perform suspicious SQL diagnostics in the OCP console, follow these steps:
In the left-side navigation pane, click Tenants and click the target tenant in the Tenants list to go to the Overview page of the tenant.
In the left-side navigation pane, click SQL Diagnostics to go to the SQL Diagnostics page.
The SQL diagnostics data is not displayed on the SQL Diagnostics page if you do not set the values of both the cluster parameter
enable_sql_auditand the tenant parameterob_enable_sql_auditto True. You can click Change Cluster Parameters in the prompt to modify the parameter values.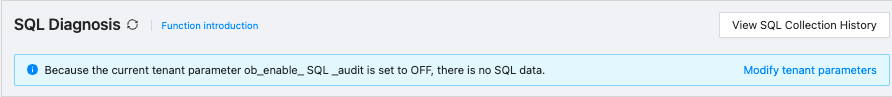
Click the Suspected SQL tab.
Filter the suspicious SQL statements.
Specify the filter conditions
Time Range: You can select Last 5 Minutes, Last 10 Minutes, Last 20 Minutes, Last 30 Minutes, Last 1 Hour, or Last 3 Hours from the Time Range drop-down list. You can also select Custom Time from the drop-down list and specify the start time and end time as needed. By default, the information for the last 30 minutes is displayed.
Internal SQL: If you select this option, the SQL statements internally initiated in OceanBase Database are displayed in the query result.
Keyword: The SQL statements that contain the specified keyword are displayed in the query result. The keywords filter SQL statements in the same way as the SQL Like operator. The entered strings are automatically prefixed and suffixed with a percent sign (%).
Advanced Conditions: You can click Add and specify a metric, an operator, and a metric value. The SQL statements that match the specified search criteria are displayed in the query result.
Click Search to list all SQL statements that meet the search criteria.
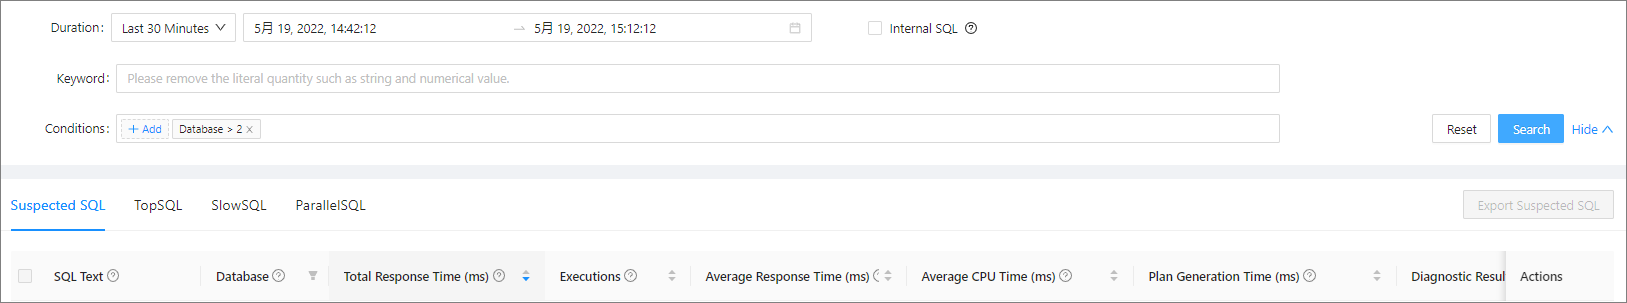
Click Export Suspicious SQL Statements to export all suspicious SQL statements in the query result.
View the information about suspicious SQL statements.
You can click the SQL text of an SQL statement to go to the SQL Details page of the statement. On the SQL Details page, you can view the following details of the SQL statement:
In the SQL Text section, you can view the complete SQL statement.
In the Optimization Suggestions section, you can view the optimization suggestions for the SQL statement.
View diagnostics details. You can specify a period and view the diagnostics results within this period.
The following table describes some diagnostic types and their suggested solutions.
Diagnostic typeRelated parameterIndex analysis required?SQL risk levelDescription and suggestionPlan change accompanied by performance degradation ocp.perf.sql-diag.performance-degradation-after-plan-changed-configNo High The execution plan of the SQL statement was changed, and the performance of the new plan was degraded. Check with the DBA. You can use an outline to fix the execution plan to verify whether the SQL statement is problematic. Table scan without available index ocp.perf.sql-diag.table-scan-index-not-exists-configYes High During the execution of the SQL statement, a full table scan was performed on some related tables because they did not have indexes available. We recommend that you create appropriate indexes. Table scan with unused index ocp.perf.sql-diag.table-scan-index-not-exists-configYes High All tables involved in the execution of the SQL statement are indexed. However, a full table scan was performed on some of these tables because their indexes were not used. Check the data distribution and business scenario. Hint with no effect ocp.perf.sql-diag.ineffective-hint-configYes High An index was specified in the hint of the SQL statement, but the specified index was not used during execution.
Check whether the hint of the SQL statement matches the actual execution plan.Performance degradation ocp.perf.sql-diag.performance-degradation-configNo Medium During the diagnostics period, the average CPU time consumed for the execution of the SQL statement is longer than the historical average.
Check the changes in data distribution and the queue in the tenant.Poor performance despite the use of index ocp.perf.sql-diag.awful-performance-index-used-configYes Medium The index was used for table access during the execution of the SQL statement, but the performance was poor.
Check the data distribution and business scenario.Execution spikes ocp.perf.sql-diag.execution-spike-configNo Medium The executions of the SQL statement suddenly increased during a period. You can view the number of executions in the Historical Trends tab of the SQL Details.
Check the business volume. A spike in the number of executions of an SQL statement may cause the overall performance to decrease.Row lock contention ocp.perf.sql-diag.row-lock-contention-high-configNo Medium Check your business scenarios to determine whether the SQL statements of the select for updatetype were executed more frequently than the specified threshold, and whether the CPU time was greater than the specified threshold.CPU utilization above threshold ocp.perf.sql-diag.cpu-time-proportion-high-configNo Low The CPU utilization is too high during the diagnostics period. The CPU utilization = CPU time for executing the SQL statement/CPU time for executing all SQL statements of the tenant × 100%.
Check your business scenarios, data distribution changes, request increases, and execution plan changes.By default, SQL diagnostics is triggered in OCP only when some attributes such as the SQL response time and execution frequency exceed the specified thresholds. You can modify default values of specific parameters on the System Parameters page of OCP to specify the objects and criteria for diagnostics. For information about the parameter, see "SQL performance module" in the OCP User Guide of the corresponding version.
On the Historical Trends tab, you can view the historical trends of the SQL statement.
On the Index tab, you can view the indexes bound to the SQL statement.
On the SQL Throttling tab, you can view or set the throttling of the SQL statement.
You can view the binding records of the SQL statement in section ① as illustrated on the Execution Plans, Index, and SQL Throttling tabs.

To throttle a suspicious SQL statement, find it in the list of suspicious SQL statements, and then click Enable Throttling in its Actions column.
To throttle multiple SQL statements, select multiple SQL statements and click Batch Set Throttling. In the dialog box that appears, specify the maximum number of SQL statements that can be executed concurrently.
Perform TopSQL diagnostics
Top SQL statements refer to SQL statements that take the longest time to execute. On the Tenant Overview page in OCP, you can filter top SQL statements by time range and OBServer node, and view the details of each top SQL statement in the list.
The procedure is as follows:
In the left-side navigation pane, click Tenants and click the target tenant in the Tenants list to go to the Overview page of the tenant.
In the left-side navigation pane, click SQL Diagnostics to go to the SQL Diagnostics page.
The SQL diagnostics data is not displayed on the SQL Diagnostics page if you do not set the values of both the cluster parameter
enable_sql_auditand the tenant parameterob_enable_sql_auditto True. You can click Change Cluster Parameters in the prompt to modify the parameter values.
Click the TopSQL tab.
Filter the top SQL statements.
Specify the filter conditions
Time Range: You can select Last 5 Minutes, Last 10 Minutes, Last 20 Minutes, Last 30 Minutes, Last 1 Hour, or Last 3 Hours from the Time Range drop-down list. You can also select Custom Time from the drop-down list and specify the start time and end time as needed. By default, the information for the last 30 minutes is displayed.
OBServer: You can select an OBServer node or all OBServer nodes in the list. If you select an OBServer node, only SQL statements executed on the selected OBServer node are queried.
Internal SQL: If you select this option, the SQL statements internally initiated in OceanBase Database are displayed in the query result.
Keyword: The SQL statements that contain the specified keyword are displayed in the query result.
Advanced Conditions: You can click Add and specify a metric, an operator, and a metric value. The SQL statements that match the specified search criteria are displayed in the query result.
Click Search to list all SQL statements that meet the search criteria.
Click Export TopSQL to export all the SQL statements in the query result.
View information about top SQL statements.
Click Custom Column. In the dialog box that appears, specify the expression and name for the custom column. Then, you can view the column in the TopSQL list.
Note
The supported operators include the plus sign (+), minus sign (-), asterisk (*), forward slash (/), and parentheses.
After a custom column is added, the SQL statements on the TopSQL tab are automatically sorted by the custom column.
Only one custom expression can be created. If a custom column already exists, after you create a custom column, the new custom column overwrites the original one.
The attribute name of the custom column must start with @ or $.
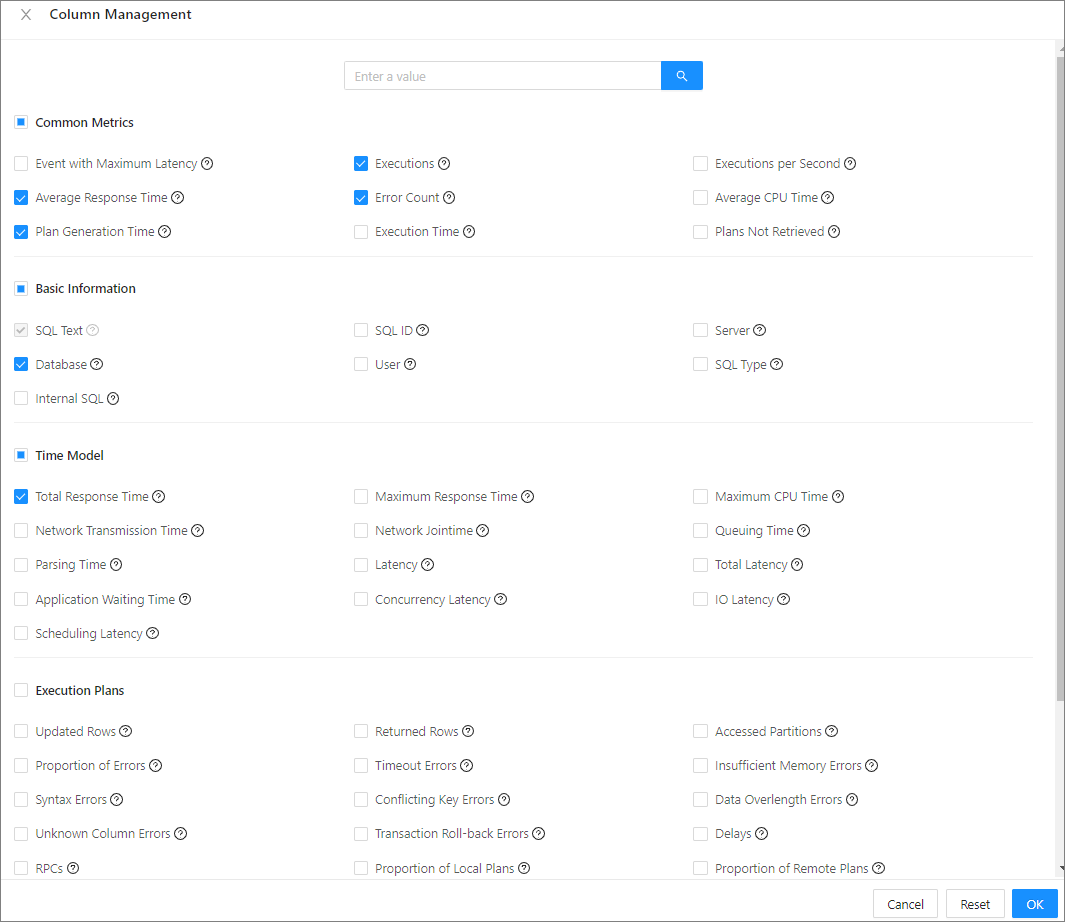
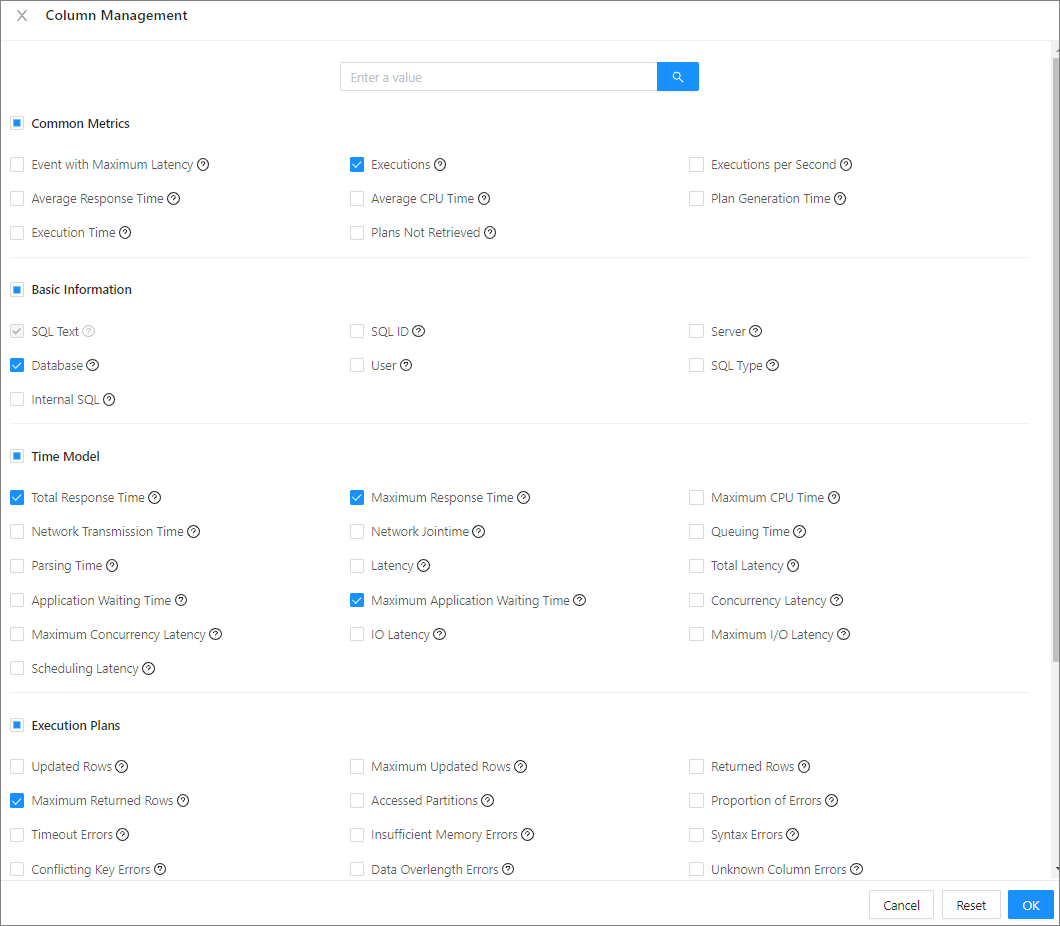
Click Column Management. In the dialog box that appears, select the columns to display. Then, you can view the selected columns in the TopSQL list.
Click the + icon on the left side of the SQL text to view the specific error details of the SQL statement.
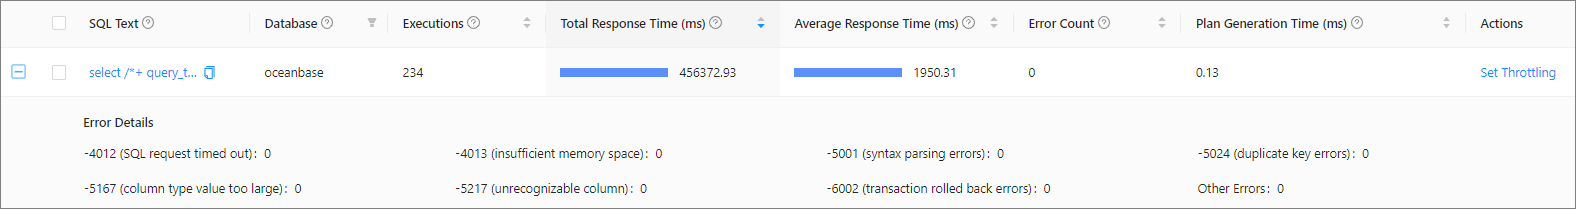
You can click the SQL text to go to the corresponding SQL text page.
On the SQL Details page, you can view the following details of the SQL statement:
In the SQL Text section, you can view the complete SQL statement.
In the Optimization Suggestions section, you can view the optimization suggestions for the SQL statement.
On the Historical Trends tab, you can view the historical trends of the SQL statement.
On the Execution Plans tab, you can view the execution plans of the SQL statement, or bind an execution plan to the statement.
On the Index tab, you can view the indexes bound to the SQL statement.
On the SQL Throttling tab, you can view or set the throttling of the SQL statement.
You can view the binding records of the SQL statement in section ① as illustrated on the Execution Plans, Index, and SQL Throttling tabs.

To throttle a top SQL statement, find it in the TopSQL list, and then click Enable Throttling in its Actions column.
To throttle multiple SQL statements, select multiple SQL statements and click Batch Set Throttling. In the dialog box that appears, specify the maximum number of SQL statements that can be executed concurrently.
Note
Keyword-based throttling is not supported in batch throttling.
Perform SlowSQL diagnostics
Before SlowSQL diagnostics, you can set a regular execution time for SQL statements.
The default execution threshold in OCP is 100 ms. You can change the threshold to 120,000 μs by executing the following statements in a command-line tool or OceanBase Developer Center (ODC):
select collect_elapsed_threshold_us from ob_agent_collection_config_history
where collection_name = 'slow_sql';
update ob_agent_collection_config_history set collect_elapsed_threshold_us = 120000 where collection_name = 'slow_sql';
Change the value of the OCP system parameter
ocp.ob.slowsql.thresholdto 120,000 μs.
To perform SlowSQL diagnostics in the OCP console, follow these steps:
In the left-side navigation pane, click Tenants and click the target tenant in the Tenants list to go to the Overview page of the tenant.
In the left-side navigation pane, click SQL Diagnostics to go to the SQL Diagnostics tab.
The SQL diagnostics data is not displayed on the SQL Diagnostics page if you do not set the values of both the cluster parameter
enable_sql_auditand the tenant parameterob_enable_sql_auditto True. You can click Change Cluster Parameters in the prompt to modify the parameter values.Click the SlowSQL tab.
Filter slow SQL statements.
Specify the filter conditions
Time Range: You can select Last 5 Minutes, Last 10 Minutes, Last 20 Minutes, Last 30 Minutes, Last 1 Hour, or Last 3 Hours from the Time Range drop-down list. You can also select Custom Time from the drop-down list and specify the start time and end time as needed. By default, the information for the last 30 minutes is displayed.
OBServer: You can select an OBServer node or all OBServer nodes in the list. If you select an OBServer node, only SQL statements executed on the selected OBServer node are queried.
Internal SQL: If you select this option, the SQL statements internally initiated in OceanBase Database are displayed in the query result.
Keyword: The SQL statements that contain the specified keyword are displayed in the query result.
Advanced Conditions: You can click Add and specify a metric, an operator, and a metric value. The SQL statements that match the specified search criteria are displayed in the query result.
Click Search to list all SQL statements that meet the search criteria.
Click Export to export all the SQL statements in the query result.
View information about slow SQL statements.
Click Column Management. In the dialog box that appears, select the columns to display. Then, you can view the selected columns in the TopSQL list.
On the SlowSQL tab, you can view the columns selected. You can also copy the SQL text, filter it by database and user, and sort it by the number of executions, total response time, response time, and CPU time.

You can click the SQL text of an SQL statement to go to the SQL Details page of the statement.
On the SQL Details page, you can view the following details of the SQL statement:
In the SQL Text section, you can view the complete SQL statement.
In the Optimization Suggestions section, you can view the optimization suggestions for the SQL statement.
In the SQL Details section, you can view the details of the slow SQL statement. You can select Last 5 Minutes, Last 10 Minutes, Last 20 Minutes, Last 30 Minutes, Last 1 Hour, or Last 3 Hours, or select Custom Time and specify a time range to view details of the SQL statement, such as the trace ID, request time, response time, execution time, physical reads, application latency, returned rows, server IP address, and client IP address. You can copy the trace ID. You can also sort the SQL traces by request time, response time, execution time, physical reads, application latency, and returned rows.
On the Historical Trends tab, you can view the historical trends of the SQL statement.
On the Execution Plans tab, you can view the execution plans of the SQL statement, or bind an execution plan to the statement.
On the Index tab, you can view the indexes bound to the SQL statement.
On the SQL Throttling tab, you can view or set the throttling of the SQL statement.
You can view the binding records of the SQL statement in section ① as illustrated on the Execution Plans, Index, and SQL Throttling tabs.

To throttle a slow SQL statement, find it in the SlowSQL list, click Enable Throttling in its Actions column.
To throttle multiple SQL statements, select multiple SQL statements and click Batch Set Throttling. In the dialog box that appears, specify the maximum number of SQL statements that can be executed concurrently.
Note
Keyword-based throttling is not supported in batch throttling.
Perform ParallelSQL diagnostics
To perform ParallelSQL diagnostics in the OCP console, follow these steps:
In the left-side navigation pane, click Tenants and click the target tenant in the Tenants list to go to the Overview page of the tenant.
In the left-side navigation pane, click SQL Diagnostics to go to the SQL Diagnostics tab.
The SQL diagnostics data is not displayed on the SQL Diagnostics page if you do not set the values of both the cluster parameter
enable_sql_auditand the tenant parameterob_enable_sql_auditto True. You can click Change Cluster Parameters in the prompt to modify the parameter values.Click the ParallelSQL tab.
Filter parallel SQL statements.
Specify the filter conditions
Time Range: You can select Last 5 Minutes, Last 10 Minutes, Last 20 Minutes, Last 30 Minutes, Last 1 Hour, or Last 3 Hours from the Time Range drop-down list. You can also select Custom Time from the drop-down list and specify the start time and end time as needed. By default, the information for the last 30 minutes is displayed.
OBServer: You can select an OBServer node or all OBServer nodes in the list. If you select an OBServer node, only SQL statements executed on the selected OBServer node are queried.
Internal SQL: If you select this option, the SQL statements internally initiated in OceanBase Database are displayed in the query result.
Keyword: The SQL statements that contain the specified keyword are displayed in the query result.
Advanced Conditions: You can click Add and specify a metric, an operator, and a metric value. The SQL statements that match the specified search criteria are displayed in the query result.
Click Search to list all SQL statements that meet the search criteria.
Click Export to export all the SQL statements in the query result.
View information about parallel SQL statements.
Click Column Management. In the dialog box that appears, select the columns to display. Then, you can view the selected columns in the ParallelSQL list.
On the ParallelSQL tab, you can view the columns selected. You can copy the SQL text and filter the SQL statements by database. You can also sort the SQL statements by the degree of parallelism, number of executions, total response time, and average response time. You can also view the diagnosis.

You can click the SQL text of an SQL statement to go to the SQL Details page of the statement, where you can view the following details of the SQL statement:
In the SQL Text section, you can view the complete SQL statement.
In the SQL Execution Profile section, you can view the execution details of the SQL statement at the operator level in the data collection time range.
On the Historical Trends tab, you can view the historical trends of the SQL statement and the generation time of the corresponding plan.
On the Execution Plans tab, you can view the execution plans of the SQL statement, or bind an execution plan to the statement.
In the binding records, you can view the status of a bound execution plan, or click Unbind to unbind the plan from the SQL statement. You can click Bind Plan to bind the plan to the SQL statement again.
On the Index tab, you can view the indexes bound to the SQL statement.
On the SQL Throttling tab, you can view or set the throttling of the SQL statement.
Click Enable Throttling to throttle the SQL statement. To throttle multiple SQL statements, select multiple SQL statements and click Batch Set Throttling. In the dialog box that appears, specify the maximum number of SQL statements that can be executed concurrently.
You can view the binding records of the SQL statement in section ① as illustrated on the Execution Plans, Index, and SQL Throttling tabs.

To throttle a parallel SQL statement, find it in the ParallelSQL list, click Enable Throttling in its Actions column.
To throttle multiple SQL statements, select multiple SQL statements and click Batch Set Throttling. In the dialog box that appears, specify the maximum number of SQL statements that can be executed concurrently.
Note
Keyword-based throttling is not supported in batch throttling.