


This topic describes how to view the historical performance monitoring information of OceanBase clusters in the OceanBase Cloud Platform (OCP) console.
View performance monitoring information of all clusters
Log on to the OCP console.
In the left-side navigation pane, click Clusters to go to the Clusters page.
On the Clusters page, you can view the information about the top 5 clusters sorted by a performance metric. You can specify a performance metric and a time range to view the top 5 clusters sorted by the specified performance metric in descending order.
You can specify a performance metric and a time range to view the information about the top 5 clusters sorted by the specified performance metric. You can click the icon in the upper-right corner to zoom in the chart for a better view.
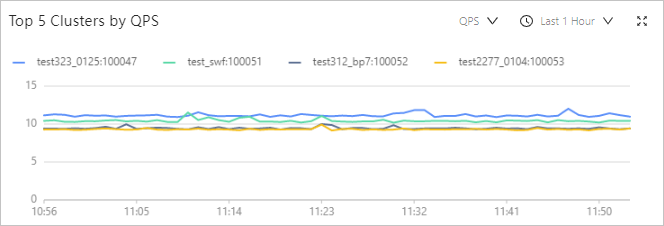
The following time ranges are available: Last 1 Hour, Last 24 Hours, and Last 7 Days.
The available performance metrics are QPS (times/s), Query Response Time (us), Active Sessions, and CPU Utilization (%). The following table describes the metrics.
MetricDescriptionQPS (times/s) The number of SQL statements processed per second in OceanBase clusters managed by OCP. Query Response Time (us) The average query response time of the cluster, in microseconds (μs). Active Sessions The total number of active sessions in the selected time range. CPU Utilization (%) The average CPU utilization of the cluster. Note
When a performance metric of a cluster surges, on the Performance Monitoring page of the cluster, locate the tenant with a sharp increase in the metric value by using correlation to identify the machine that has a surge in the metric. For more information, see Performance monitoring for a specific cluster in this topic.
View performance monitoring information of all tenants
Log on to the OCP console.
In the left-side navigation pane, click Tenants to go to the Tenants page.
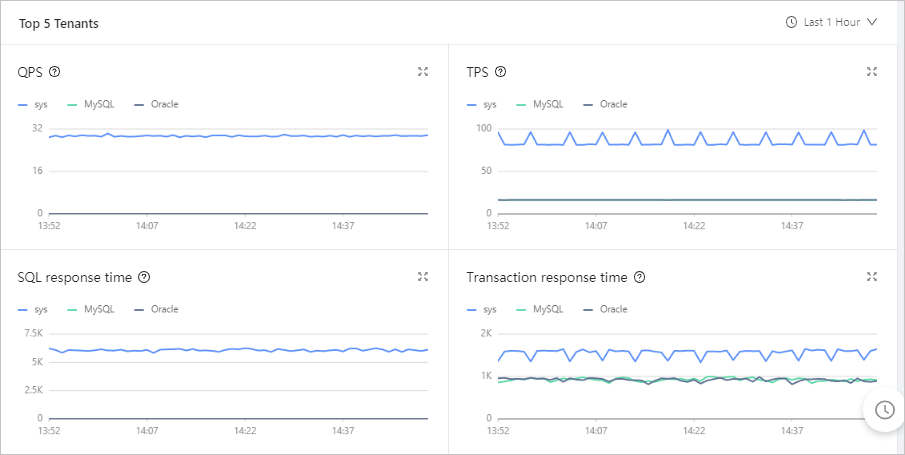
In the Top 5 Tenants section on the Tenants page, you can view the top 5 tenants sorted by performance metrics such as TPS, QPS, SQL response time, transaction response time, number of active sessions, event waiting_count, event waiting_time, capacity_tables, and capacity_partitions.
You can view the monitoring information for the last 1 hour, the last 24 hours, or the last 7 days. You can click the zoom-in icon in the upper-right corner to zoom in the chart or select a monitoring time range.

The following table describes the performance monitoring metrics.
MetricDescriptionSourceQPS The average number of SQL statements processed per second. v$sysstatTPS The average number of transactions processed per second. v$sysstatSQL response time The average time consumed by the server to process an SQL statement, in microseconds (μs). v$sysstatTransaction response time The average time consumed by the server to process a transaction, in microseconds (μs). v$sysstatNumber of active sessions The number of active sessions. __all_virtual_processlistEvent waiting_count The number of wait events per second. v$system_eventEvent waiting_time The average time of a wait event, in microseconds (μs). v$system_eventCapacity_tables The number of tables. gv$tableCapacity_partitions The number of partitions. v$partitionNote
When a performance metric of a tenant surges, on the Performance Monitoring page of the tenant, use correlation to identify the machine that has a surge in the metric. For more information, see Performance monitoring for a specific tenant in this topic.
View performance monitoring information of a specific cluster
Log on to the OCP console.
In the Clusters list on the Clusters page, find the target cluster and click its name.
In the left-side navigation pane on the page that appears, click Performance Monitoring.
In the Data Filtering area, you can specify the following parameters to filter performance information:
Turn off Real-time: After you specify the filter conditions, the system displays the performance monitoring data based on the specified value of Select Time and Stat Period.
Turn on Real-time: After you specify a statistical range, the system displays the real-time performance monitoring data in the specified statistical range.
The following table describes the filter conditions.
Filter conditionDescriptionSelect Time It is not displayed in real-time mode. Select a time range for the data that you want to query. Stat Period It is not displayed in real-time mode. Select the statistical period for each data point. Valid values: Per Minute and Per Second, which respectively mean one data point per minute and one data point per second. OCP also calculates one more statistical period based on the selected time range to make the number of data points returned approximate 1,440. If the selected time range is long, the statistical period may be longer than one minute. Zone/OBServer Select a zone or an OBServer node in a zone as the statistical range. By default, the monitoring data of all zones is collected. 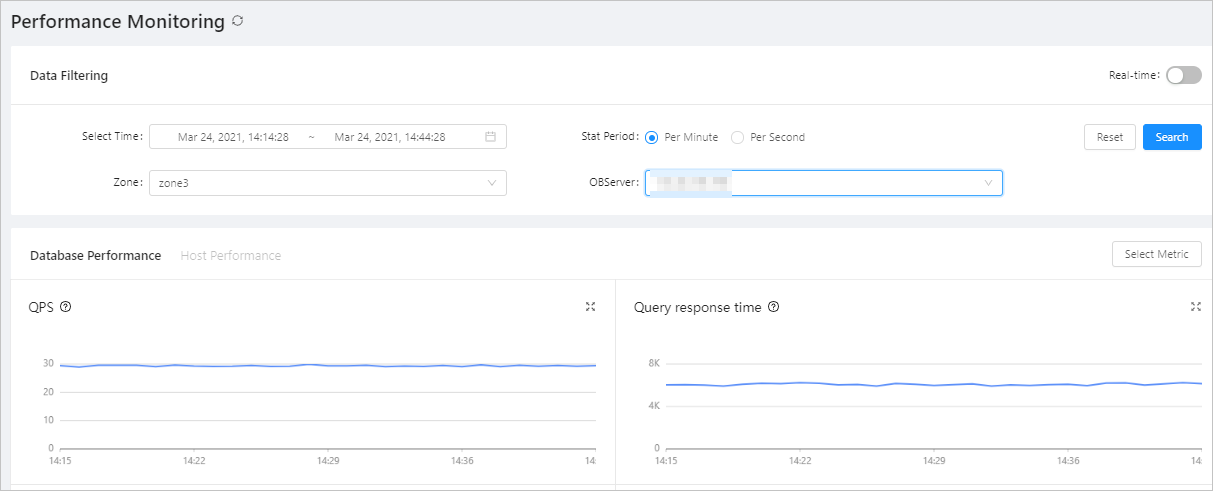
You can respectively view the performance data of databases and hosts in the cluster on different tabs.
Click the Database Performance tab.
To display other metrics, click Select Metric on the right side and select the desired metrics in the Select Metric panel. The system can display up to 10 metrics.
Click the Host Performance tab.
If the statistical range covers multiple OBServer nodes, the aggregate metric values of the OBServer nodes are displayed.
To display other metrics, click Select Metric on the right side and select the desired metrics in the Select Metric panel. The system can display up to 10 metrics.
For more information about database performance metrics and host performance metrics, see the "Monitoring metrics" appendix in the OCP User Guide of the corresponding version.
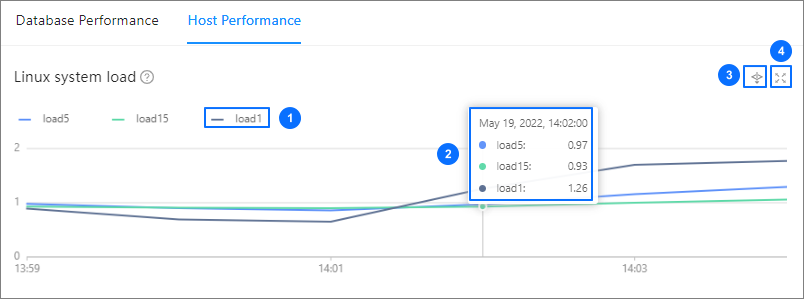
The following features enable you to better view and analyze the performance monitoring data on a trend chart. You can learn about the features with the help of the figure below.
Note
The drill-down feature is available on the Performance Monitoring page of a cluster or tenant but is not available on the Monitoring page of a host.
Filter data.
View the trend details of a metric over a specific period, as shown in section ① in the preceding figure. To use this feature, drag the pointer over the period to select this period. Then, the system displays the trend details in a zoomed-in view. After you view the trend details, double-click the trend chart to return to normal.
Hide the data of a submetric, as shown in section ② in the preceding figure. To use this feature, click the icon of the submetric. The submetric will then turn gray and its data will be hidden from the chart.
View data at a specific point in time, as shown in section ③ in the preceding figure. To use this feature, move the pointer over this point in time on the trend chart.
Zoom in on the trend chart. To use this feature, click the zoom-in icon in the upper-right corner. The features shown in sections ①, ②, and ③ in the preceding figure are also applicable to a zoomed-in chart.
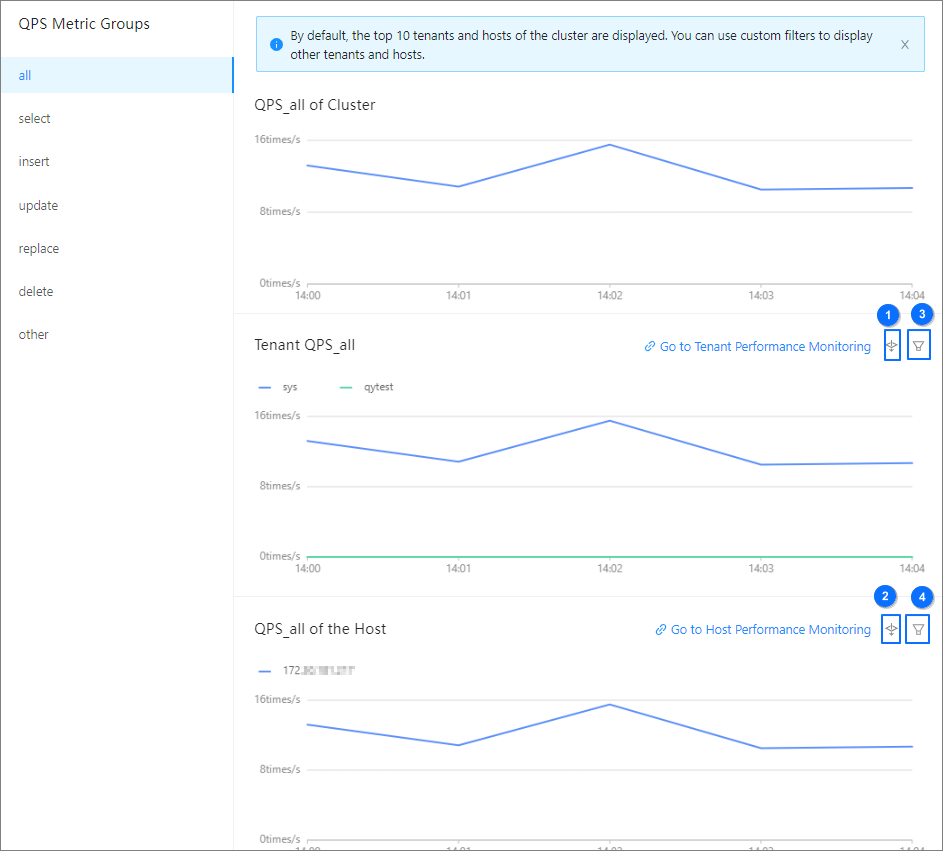
To view monitoring data in different dimensions, perform a drill-down analysis. When an abnormal metric exists, such as the long response time of a tenant, perform a drill-down analysis to identify the faulty server. To use this feature, click the Drill-down Analysis icon in the upper-right corner of the trend chart.
The Database Performance tab supports the following drill-down dimensions: cluster > tenant > host.
The Host Performance tab supports the following drill-down dimensions: cluster > host.
The features shown in sections ①, ②, and ③ in the preceding figure are also applicable to a trend chart on a drill-down page. You can also perform the following operations:
In the Data Filtering section of the drill-down page, specify filter conditions. If you do not specify any filter conditions, the drill-down page automatically inherits filter conditions from the upper-level page.
If the metric has submetrics, you can view the submetrics or click the button in section ① or ② to drill down to other dimensions for further analysis.
To go to the Performance Monitoring page of the tenant, move the pointer over the Go to Tenant Performance Monitoring link in the upper-right corner of the trend chart, and then select and click the tenant.
To go to the Monitoring page of the host, move the pointer over the Go to Host Performance Monitoring link in the upper-right corner of the trend chart, and then select and click the host.
If the metric is involved in the performance of a tenant or host, you can directly go to the Monitoring page of the tenant or server from the trend chart.
You can also click the button in section ③ or ④ in the upper-right corner of a trend chart to select the tenant or host whose data needs to be displayed on the trend chart.
View tenant performance monitoring information of a specific cluster
You can view the performance information of the five tenants with the highest workload in a cluster.
Log on to the OCP console.
In the Clusters list on the Clusters page, find the target cluster and click its name.
In the left-side navigation pane of the page that appears, click Tenant Management.
In the Top 5 Tenants section on the Tenant Management page, you can view the top 5 tenants sorted by performance metrics such as TPS, QPS, SQL response time, transaction response time, number of active sessions, event waiting_count, event waiting_time, capacity_tables, and capacity_partitions.
You can specify a performance metric and a time range to view the information about the top 5 clusters sorted by the specified performance metric. You can click the icon in the upper-right corner to zoom in the chart for a better view.
The following table describes the performance monitoring metrics.
MetricDescriptionSourceQPS The average number of SQL statements processed per second. v$sysstatTPS The average number of transactions processed per second. v$sysstatSQL response time The average time consumed by the server to process an SQL statement, in microseconds (μs). v$sysstatTransaction response time The average time consumed by the server to process a transaction, in microseconds (μs). v$sysstatNumber of active sessions The number of active sessions. __all_virtual_processlistEvent waiting_count The number of wait events per second. v$system_eventEvent waiting_time The average time of a wait event, in microseconds (μs). v$system_eventCapacity_tables The number of tables. gv$tableCapacity_partitions The number of partitions. v$partitionNote
When the value of a performance metric in a tenant of the cluster surges, you can locate the host on which the performance metric value surge is detected on the Performance Monitoring page of the tenant. For more information, see Performance monitoring for a specific tenant in this topic.
View performance monitoring information of a specific tenant
Log on to the OCP console.
In the left-side navigation pane, click Tenants.
In the Tenants list, click the name of the target tenant to go to the Overview page.
In the left-side navigation pane, click Performance Monitoring.
In the Data Filtering area, you can specify the following parameters to filter performance information:
Turn off Real-time: After you specify the filter conditions, the system displays the performance monitoring data based on the specified value of Select Time and Stat Period.
Turn on Real-time: After you specify a statistical range, the system displays the real-time performance monitoring data in the specified statistical range.
The following table describes the filter conditions.
ConditionDescriptionSelect Time It is not displayed in real-time mode. Select a time range for the data that you want to query. Stat Period Select a statistical period for each data point. Valid values: Per Minute and Per Second, which respectively means one data point per minute and one data point per second. OCP also calculates one more statistical periods based on the selected time range to make the number of data points returned approximate 1,440. If the selected time range is long, the statistical period may be longer than one minute. Zone/OBServer Select a zone or an OBServer node in a zone as the statistical range. By default, the monitoring data of all zones is collected. 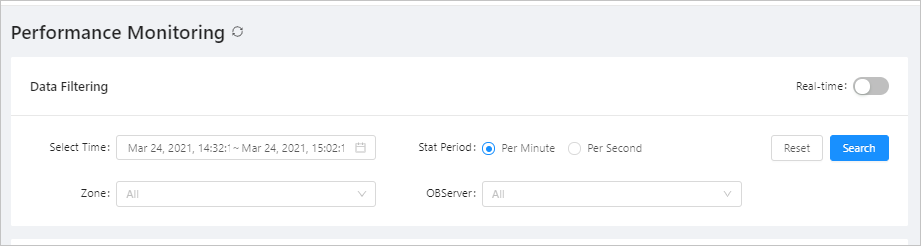
Click the Performance & SQL, Transaction, and Storage and Cache tabs to view the corresponding monitoring data of the tenant.
On the Performance & SQL tab, view the monitoring statistics for the following metrics of the tenant:
QPS: the average number of SQL statements processed per second.
Response Time: the response time, in microseconds (μs).
Active Sessions: the number of active sessions.
SQL Execution Plan Category: the category of the SQL execution plan.
Waiting for Events: the average number of wait events per second.
Waiting for Event Time: the average wait time of a wait event, in microseconds (μs).
Request Waiting Queue: the number of SQL statements entering the request queue per second.
Request Waiting Queue Time-Consuming: the wait time of an SQL request in a queue, in microseconds (μs).
CPU Utilization: the CPU utilization, in percent (%).
MemStore Usage: the MemStore usage, in percent (%).
RPC Packet RT: the time used to receive and send RPC messages.
RPC Packet Throughput: the number of bytes in the RPC messages received and sent in a specified period.
On the Transaction tab, view the monitoring data of the following metrics of the tenant:
TPS: the average number of transactions processed per second.
Transaction Response Time: the average processing time of each transaction on the server, in microseconds (μs).
Number of Transaction Logs: the number of transaction logs submitted per second.
Transaction Log Volume: the data volume of the transaction logs submitted per second, in bytes.
Transaction Log Time-Consuming: the average time consumed for processing a transaction log on the server, in microseconds (μs).
Lock Wait: the number of transaction lock waits per second.
Wait for Lock Time: the average wait time for a lock, in microseconds (μs).
On the Storage and Cache tab, view the monitoring data of the following metrics of the tenant:
MemStore: the writable memory of the OceanBase database in megabytes (MB).
IOPS: the average number of I/O requests processed per second.
I/O Time: the average time consumed for processing an I/O request, in microseconds (μs).
IO Throughput: the average volume of I/O data processed per second, in bytes.
Cache Size: the size of the cache, in megabytes (MB).
Cache Hit Rate: the cache hit rate, in percent (%).
The following features allow you to view and analyze the performance monitoring data on a trend chart in a more efficient manner. You can learn about the features with the help of the figure below.
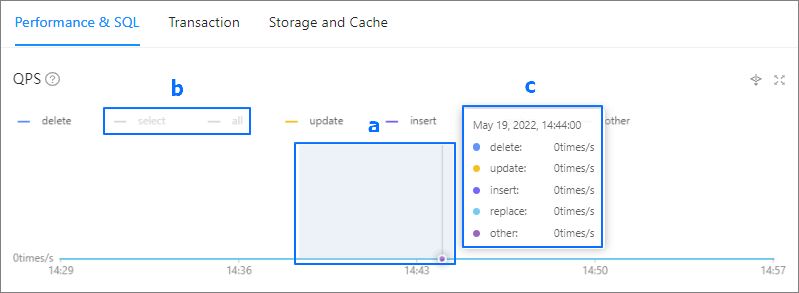
Filter data.
View the trend details of a metric over a specific period. To use this feature, drag the pointer over the period to select this period. Then, the system displays the trend details in a zoomed-in view. After you view the trend details, double-click the trend chart to return to normal.
Hide the data of a submetric. To use this feature, click the icon of the submetric. The submetric will then turn gray and its data will be hidden from the chart.
View data at a specific point in time. To use this feature, move the pointer over this point in time on the trend chart.
View SQL request analysis.
In the Response Time trend chart, click SQL Request Analysis in the upper-right corner to view the request analysis details. For more information, see the OCP User Guide.
Note
SQL request analysis is available only on the Response Time trend chart.
To view monitoring data in different dimensions, perform drill-down analysis.
When an abnormal metric exists, such as long response time of a tenant, perform drill-down analysis to identify the faulty server. To view the drill-down analysis details, click the Drill-down Analysis icon in the upper-right corner of the trend chart.
The Performance & SQL tab supports the following drill-down dimensions: tenant > OBServer node.
The Transaction tab supports the following drill-down dimensions: tenant > OBServer node.
The Storage and Cache tab supports the following drill-down dimensions: tenant > OBServer node.
The preceding features a, b, and c are also applicable to a trend chart on a drill-down page. You can also perform the following operations:
In the Data Filtering section of the drill-down page, specify filter conditions. If you do not specify any filter conditions, the drill-down page automatically inherits filter conditions from the upper-level page.
If the metric has submetrics, you can view the submetrics or drill down to other dimensions.
The trend chart can show the SQL statements that are most frequently requested and an entry to the host performance monitoring feature.
To view the TopSQL diagnostics details for the tenant, click the Search for the SQL statement with most requests link. Move the pointer over the Go to Host Performance Monitoring link and select the desired host to go to the Performance Monitoring page of the host.