This topic describes how to view the status monitoring information of OceanBase clusters in the OceanBase Cloud Platform (OCP) console.
Prerequisites
Before you log on, make sure that you have read-only permissions or management permissions on the cluster. Otherwise, you cannot view the overview data of the cluster. For more information about permissions, see the "Default OCP roles" topic in the OCP User Guide. For more information about permission operations, see the "Create a user" topic in the OCP User Guide.
Procedure
Log on to the OCP console.
In the left-side navigation pane, click Clusters to go to the Clusters page.
The Clusters page displays the general information about clusters of the user in the following sections: Top 5 Clusters by QPS, Top 5 Clusters by Elapsed Time of Major Compaction, Server Resources, Resource Usage, and Clusters.
View the overview of clusters.
Top 5 Clusters by QPS
Displays the top 5 clusters sorted by a specified performance metric in descending order in a specified time range. You can specify the performance metric and the time range as needed. You can click the icon in the upper-right corner to zoom in the chart for a better view.
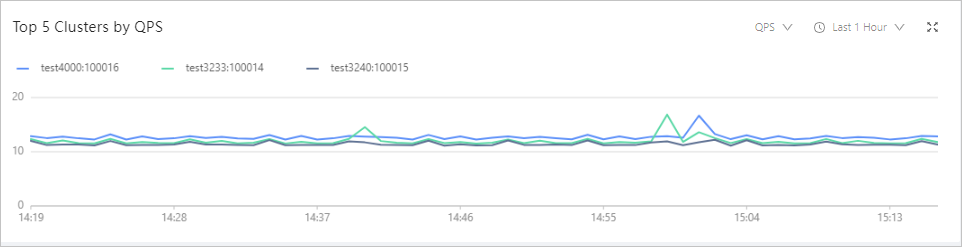
The following time ranges are available: Last 1 Hour, Last 24 Hours, and Last 7 Days.
The available performance metrics are QPS (times/s), Query Response Time (us), Active Sessions, and CPU Utilization (%). The following table describes the metrics.
MetricDescriptionQPS (times/s) The number of SQL statements processed per second in OceanBase clusters managed by the current OCP cluster. Query Response Time (us) The average query response time of the cluster, in microseconds (μs). Active Sessions The total number of active sessions in the selected time range. CPU Utilization (%) The average CPU utilization of the cluster. Note
When a performance metric of a cluster surges, on the Performance Monitoring page of the cluster, locate the tenant with a sharp increase in the metric value by using correlation to identify the machine that has a surge in the metric. For more information, see View performance monitoring information.
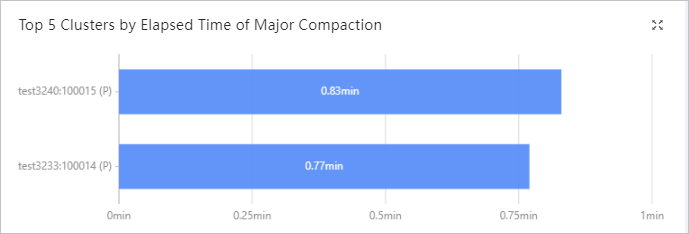
Top 5 Clusters by Elapsed Time of Major Compaction
Displays a bar chart of five clusters with the longest major compaction time in the last three days. A major compaction merges all dynamic and static data, which is time-consuming. When the incremental data generated in minor compactions reaches the specified threshold, OceanBase Database performs a major compaction on data of the same major version.
This section is empty if no major compaction has been performed in the last three days. You can click the icon in the upper-right corner to zoom in the chart for a better view.
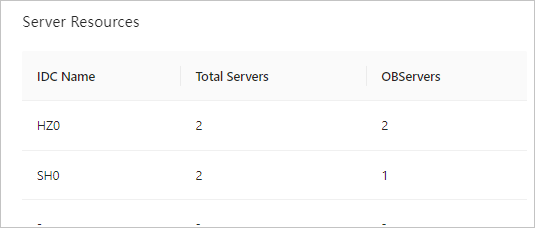
Server Resources
Displays information about each IDC, including the IDC name, total number of servers, and number of servers where OBServer nodes are deployed. You can determine whether it is necessary to perform a cluster scale-out based on such information.
Resource Usage
Displays resource usage information of each cluster, including the cluster name, number of tenants, allocated CPU resources in percentage, allocated memory in percentage, and occupied disk space. You can sort clusters by the allocated CPU resources, allocated memory, and occupied disk space.
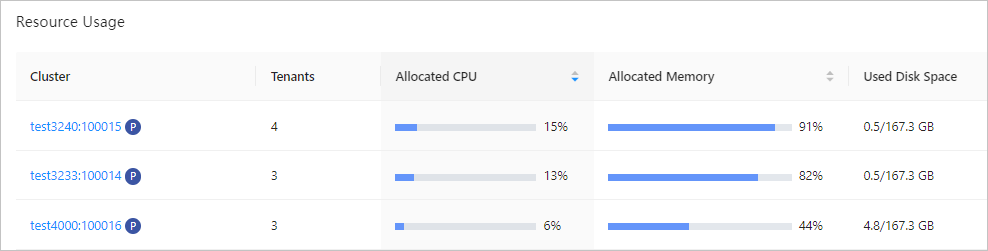
You can click the name of a cluster to go to the cluster details page.
Clusters
Displays the information of each cluster in the following fields: Cluster Name, ID, OceanBase Version, Deployment Mode, Hardware Architecture, Status, Created At, and Alert Information.
For clusters in the primary/standby relationship, only information about the primary cluster is displayed by default. You can click the Plus icon on the left to view information about the standby clusters.
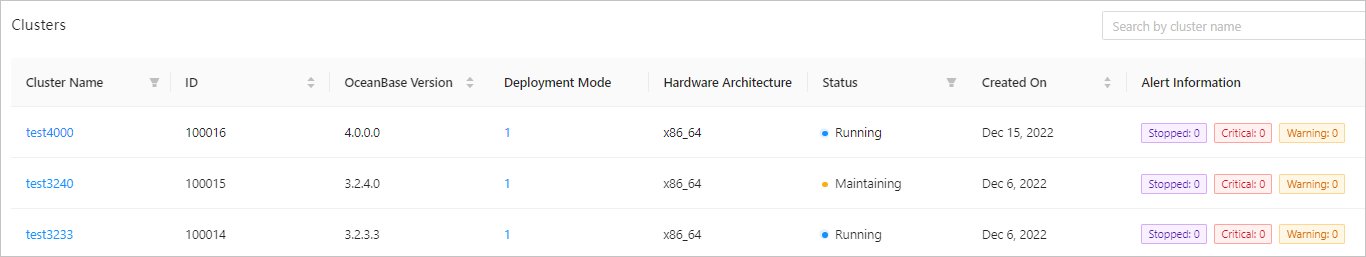
Click a cluster name to go to the Overview page of the cluster. The Overview page displays the basic information of the cluster in the following fields: Resource Usage, Alert Overview, System Events in Last 7 Days, Zones, and OBServers.
View the basic information
On the Overview page, you can view the basic information of the cluster in the following fields: Cluster Type, OceanBase Version, Regions, Deployment Mode, Hardware Architecture, Servers, Partitions, Tenants, Created By, OBProxy Cluster, Protection Mode, Software Installation Path, Data Disk Path, Log Disk Path, and ConfigUrl.
Note
If you have not associated the cluster with an OceanBase Database Proxy (ODP) cluster, click Associate OBProxy Cluster to associate it with an ODP cluster.
ParameterDescriptionCluster Type Valid values: Primary Cluster and Standby Cluster. OceanBase Version The OceanBase Database version of the cluster. Regions The number of regions in the cluster. Deployment Mode The deployment mode of the cluster.
The value 1 indicates that the cluster has one zone and the zone has one host.
The value 1-1 indicates that the cluster has two zones, and each zone has one host.
The value N-N-...N (M Ns) indicates that the cluster has M zones and each zone has N hosts.Hardware Architecture When you add a host, OCP automatically identifies its hardware architecture. The primary cluster and standby clusters must have the same hardware architecture. Servers The number of hosts in the cluster. Partitions The number of partitions for the tables in the cluster. Tenants The number of tenants in the cluster. Created By The username of the user who created the cluster. OBProxy Cluster Displays the ODP cluster that is associated with the current OceanBase cluster. - If the cluster is not associated with an ODP cluster, click Associate OBProxy Cluster to associate it with one or more ODP clusters.
- If the cluster is associated with ODP clusters, you can click the edit icon to add or delete ODP clusters.
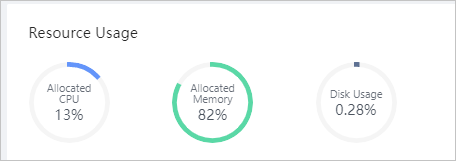
Protection Mode It is displayed when the cluster is a primary cluster. Software Installation Path The path specified when the cluster was created. Data Disk Path The path specified when the cluster was created. Log Disk Path The path specified when the cluster was created. ConfigUrl The cluster URL. You can click the copy icon to copy it. Resource Usage
The Resource Usage section displays Free CPU, Free Memory Capacity, and Free Disk Space. You can manage the cluster based on resource usage.
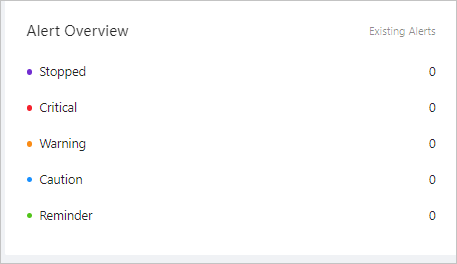
Alert Overview
The Alert Overview section displays the alerts in the system by alert levels, including Stopped, Critical, Warning, Caution, and Reminder. You can click Last 24 Hours, Last 7 Days, or Last 30 Days to view alerts in the specified time range. You can click the digit after an alert level to view the alert details.
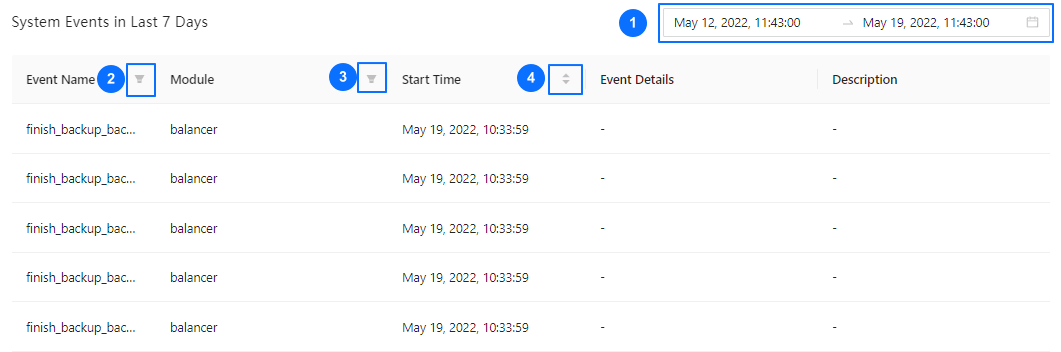
System Events in Last 7 Days
You can set query conditions in System Events in Last 7 Days to query the system events in the last 7 days.
You can specify a time range in the time selection field.
You can filter events in the Event Name column.
You can sort the events in ascending or descending order by the start time in the Start Time column.
The system lists the system events that meet the foregoing criteria you specified.
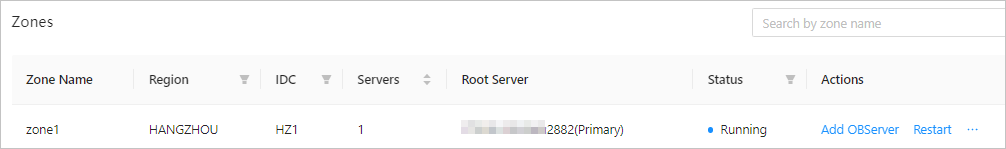
Zones
In the Zones section, you can search for zones. The table contains the following columns: Region, IDC, Servers, Root Server, and Status The Actions column provides the following options: Add OBServer, Restart, Stop, and Delete.
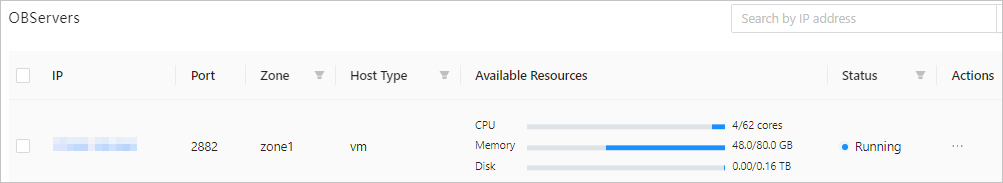
OBServers
You can view OBServer information in the OBServers list in the following columns: IP, Port, Zone, Host Type, Resource Usage, Status, and Actions. The Actions column provides the following options: Restart, Stop Service, Stop Process, Replace, Delete, and Download Logs.