


View cluster information by using the command line tool
Log on to the
systenant as therootuser.[root@xxxx ~]# obclient -h10.10.10.1 -P2881 -uroot@sys -p -A Enter password: Welcome to the OceanBase monitor. Commands end with ; or \g. Your OceanBase connection id is 3221487637Access the database named
oceanbase.obclient> use oceanbase; Database changedView cluster information from a view.
Execute the following statement to view the ID, name, and creation time of the cluster in the v$ob_cluster view:
obclient> SELECT * FROM v$ob_cluster\G
*************************** 1. row ***************************
                cluster_id: 14
              cluster_name: test3232
                   created: 2022-09-08 14:43:27.254167
              cluster_role: PRIMARY
            cluster_status: VALID
               switchover#: 0
         switchover_status: NOT ALLOWED
           switchover_info: NONE SYNCED STANDBY CLUSTER
               current_scn: 1662620251109247
standby_became_primary_scn: 0
        primary_cluster_id: NULL
           protection_mode: MAXIMUM PERFORMANCE
          protection_level: MAXIMUM PERFORMANCE
    redo_transport_options: ASYNC NET_TIMEOUT = 30000000
1 row in set
Execute the following statement to view information about all zones in the cluster in the
__all_zoneview:obclient> SELECT * FROM __all_zone WHERE name='idc'; +----------------------------+----------------------------+-------+------+-------+------+ | gmt_create | gmt_modified | zone | name | value | info | +----------------------------+----------------------------+-------+------+-------+------+ | 2022-09-08 14:43:39.940623 | 2022-09-08 14:44:04.161923 | zone1 | idc | 0 | HZ0 | | 2022-09-08 14:43:39.942688 | 2022-09-08 14:44:04.169328 | zone2 | idc | 0 | HZ0 | | 2022-09-08 14:43:39.943735 | 2022-09-08 14:44:04.175624 | zone3 | idc | 0 | HZ0 | +----------------------------+----------------------------+-------+------+-------+------+ 3 rows in setThe following table describes the fields.
FieldDescriptiongmt_create The time when the zone was created. gmt_modified The time when the zone was last updated. zone The name of the zone. name The name of the information item. value The value of the information item. info The string that represents the information value. You can execute the following statement to query the
__all_serverview and learn about the information of all OBServer nodes in the cluster, such as their IP addresses, service ports, internal communication ports, zones, and status:obclient> SELECT id,svr_ip,svr_port,zone,inner_port,with_rootserver,status,start_service_time,last_offline_time FROM __all_server; +----+----------------+----------+-------+------------+-----------------+--------+--------------------+-------------------+ | id | svr_ip | svr_port | zone | inner_port | with_rootserver | status | start_service_time | last_offline_time | +----+----------------+----------+-------+------------+-----------------+--------+--------------------+-------------------+ | 1 | 10.10.10.1 | 2882 | zone3 | 2881 | 1 | active | 1662619523361997 | 0 | | 2 | 10.10.10.2 | 2882 | zone2 | 2881 | 0 | active | 1662619523371177 | 0 | | 3 | 10.10.10.3 | 2882 | zone1 | 2881 | 0 | active | 1662619523366233 | 0 | +----+----------------+----------+-------+------------+-----------------+--------+--------------------+-------------------+ 3 rows in setThe following table describes the fields.
FieldDescriptionid The ID of the node. svr_ip The IP address of the node. svr_port The port number of the node. zone The name of the zone. inner_port The port for SQL execution. with_rootserver Specifies whether RS is deployed on the OBServer node. status The status of the OBServer node. Valid values: - active: The OBServer node is running properly.
- inactive: The OBServer node failed.
- deleting: The OBServer node is being deleted.
start_service_time The time in point when the OBServer node started running. last_offline_time The time in point when the OBServer node was last removed. Execute the following statement to query the
__all_virtual_server_statview and learn about the resource usage of the cluster:obclient> SELECT zone, concat(svr_ip, ':', svr_port) observer, cpu_capacity, cpu_total, cpu_assigned, cpu_assigned_percent, mem_capacity, mem_total, mem_assigned, mem_assigned_percent, unit_Num, round(`load`, 2) `load`, round(cpu_weight, 2) cpu_weight, round(memory_weight, 2) mem_weight, leader_count FROM __all_virtual_server_stat ORDER BY zone,svr_ip; +-------+---------------------+--------------+-----------+--------------+----------------------+--------------+-------------+--------------+----------------------+----------+------+------------+------------+--------------+ | zone | observer | cpu_capacity | cpu_total | cpu_assigned | cpu_assigned_percent | mem_capacity | mem_total | mem_assigned | mem_assigned_percent | unit_Num | load | cpu_weight | mem_weight | leader_count | +-------+---------------------+--------------+-----------+--------------+----------------------+--------------+-------------+--------------+----------------------+----------+------+------------+------------+--------------+ | zone1 | 10.10.10.1:2882 | 62 | 62 | 5.5 | 8 | 53687091200 | 53687091200 | 25769803776 | 48 | 3 | 0.42 | 0.16 | 0.84 | 1585 | | zone2 | 10.10.10.2:2882 | 62 | 62 | 5.5 | 8 | 53687091200 | 53687091200 | 25769803776 | 48 | 3 | 0.42 | 0.16 | 0.84 | 0 | | zone3 | 10.10.10.3:2882 | 62 | 62 | 5.5 | 8 | 53687091200 | 53687091200 | 25769803776 | 48 | 3 | 0.42 | 0.16 | 0.84 | 0 | +-------+---------------------+--------------+-----------+--------------+----------------------+--------------+-------------+--------------+----------------------+----------+------+------------+------------+--------------+ 3 rows in set
View resource information of a cluster in the OCP console
OceanBase Cloud Platform (OCP) allows the administrator to manage resources. For example, the administrator can view the resource unit distribution and resource usage in a cluster. The Unit Distribution tab displays the physical distribution and resource usage of each tenant in the OceanBase cluster. The Resource Usage tab displays the resource usage trends of the cluster.
Log on to the OCP console. In the left-side navigation pane, click Clusters. On the Clusters page, click the target cluster to go to the Cluster Overview page. In the left-side navigation pane, click Resource Management. The Resource Management page appears.
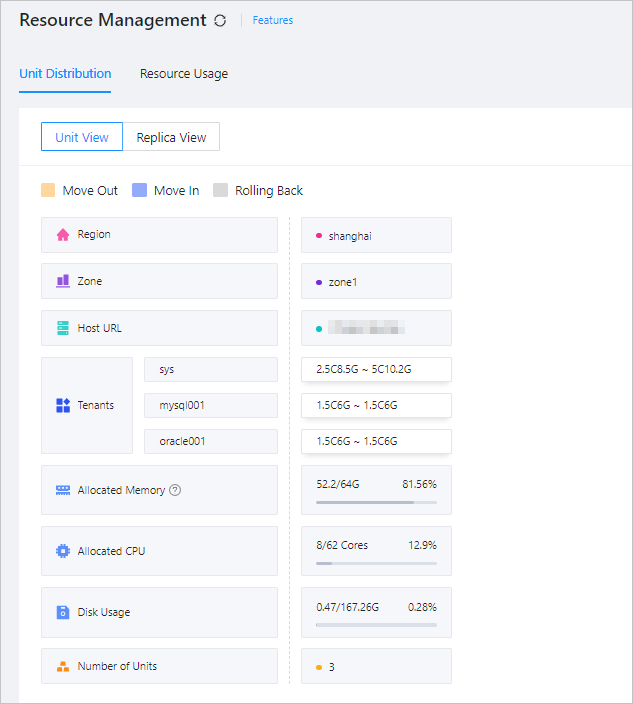
Unit distribution
You can click the Unit Distribution tab to view the distribution of resource units.
Click Tenant in the upper-right corner of the tab to select a tenant.
Click Region in the upper-right corner of the tab to select the physical region where the current cluster is located.
Click Zone in the upper-right corner of the tab to select Zone1, Zone2, or Zone3.
Click Type in the upper-right corner of the tab to select the host type.
Click the Refresh icon to obtain the latest monitoring data of unit distribution.
Check load balancing of the cluster:
You can view the values of Allocated Memory, Allocated CPU, and Used Disks of each zone to check whether the usage of the same type of resource is balanced across the servers in the zone. If not, you can modify the load balancing parameters of the OceanBase cluster to implement load balancing.
Evaluate whether the cluster needs to scale out:
You may consider a cluster scale-out when the value of Used Disks reaches 80%.
View the resource distribution of a tenant:
You can click Tenant in the upper-right corner of the tab, select the target tenant from the drop-down list, and then click OK to view the resource distribution of the tenant.
Manually implement load balancing:
If the built-in load balancing algorithms of the OceanBase cluster cannot meet your needs, you can double-click a unit config next to the tenant to manually migrate resources, but only within a single zone.
Note
We recommend that you disable the automatic load balancing feature of the OceanBase cluster before you manually implement load balancing, because the feature may migrate the unit back to the original locality.
Note
The Number of Units row displays the number of units in the cluster. If the number of units is greater than the number of tenants, units that are not associated with a tenant exist. You can delete or compact the units that have been idle for more than one hour.
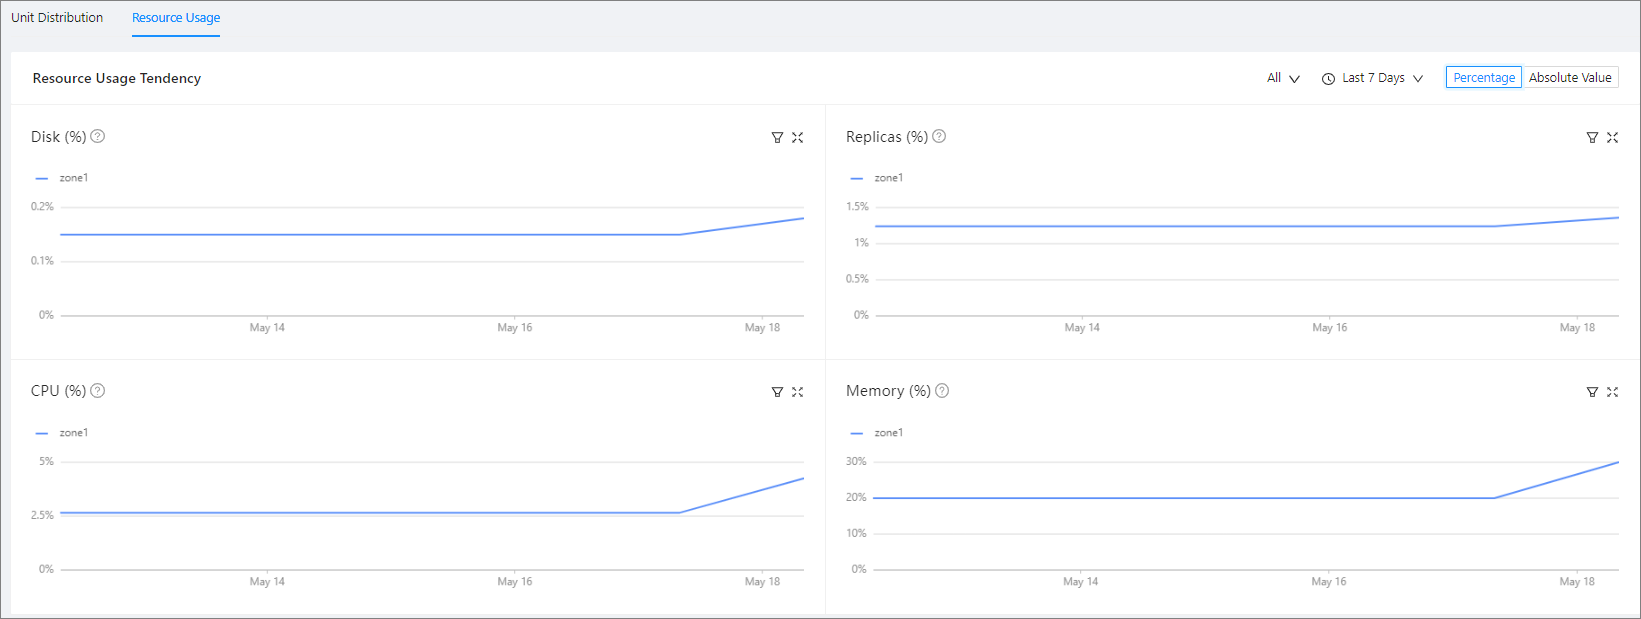
Resource usage
In the Resource Usage Tendency section, you can view the Disk, Replicas, CPU, and Memory trend charts. The CPU and Memory trend charts display the trend of resource allocation, and the Disk and Partitions trend charts display the trend of resource usage. You can move the pointer over a resource change point in time on the CPU utilization or memory usage curve to view the resource change event of resource allocation at the current point in time relative to the previous point in time. The event information is generated based on the value differences between the two resource allocations and may not include all associated events.
Note
Resource usage trend data is collected once every day to display trends of resource allocation and usage. It is not suitable for observing the real-time changes in resources.
Click All in the upper-right corner, and choose All, Zone1, Zone2, or Zone3 from the drop-down list to view the resource usage trends in different scopes.
Click Last 7 Days in the upper-right corner, and choose Last 7 Days, Last Month, Last Six Months, or Last Year to view the resource usage trends in different periods.
Click Percentage or Absolute Value to switch the mode of the trend charts.
Click the filter icon in the upper-right corner of each trend chart to view the resource usage of different zones.
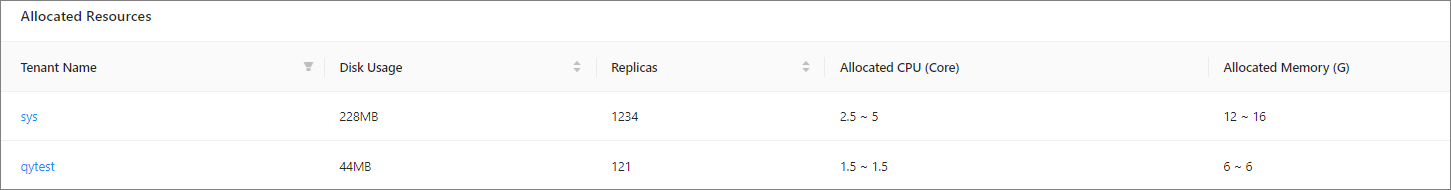
The table in the Allocated Resources section contains the following columns: Tenant Name, Used Disks, Replicas, Allocated CPU (Core), and Allocated Memory (G). Click the name of a tenant to go to the overview page of the tenant.
Note
Due to high query costs, the query results of tenant resource allocation statistics are returned based on cached data. This may result in a 2-minute lag with the real-time condition. In this case, for the allocated resources that do not belong to any tenant, N/A is displayed in the Tenant Name column, indicating that such resources can be released.
More information
For more information about the resource distribution of tenants in a cluster, see the following topics: