This topic describes how to view the information about an OceanBase Database tenant by using views or OceanBase Cloud Platform (OCP).
Check tenants in a cluster and their resource distribution information from views
You can check all tenants in a cluster and their resource distribution information from different views.
Log on to the
systenant as therootuser.Access the database named
oceanbase.Check the following information from different views:
Resource distribution information of tenants
obclient> SELECT * FROM gv$unit;
 +---------+----------------+-------------------------------+------------------+--------------------------+-------+-----------+-------------+----------------+----------+---------------------+-----------------------+---------+---------+-------------+-------------+----------+----------+---------------+---------------------+
 | unit_id | unit_config_id | unit_config_name              | resource_pool_id | resource_pool_name       | zone  | tenant_id | tenant_name | svr_ip         | svr_port | migrate_from_svr_ip | migrate_from_svr_port | max_cpu | min_cpu | max_memory  | min_memory  | max_iops | min_iops | max_disk_size | max_session_num     |
 +---------+----------------+-------------------------------+------------------+--------------------------+-------+-----------+-------------+----------------+----------+---------------------+-----------------------+---------+---------+-------------+-------------+----------+----------+---------------+---------------------+
 |       1 |              1 | sys_unit_config               |                1 | sys_pool                 | zone1 |         1 | sys         | 10.10.10.1 |     2882 |                     |                     0 |       5 |     2.5 | 16106127360 | 12884901888 |    10000 |     5000 |  179593805824 | 9223372036854775807 |
 |       2 |              1 | sys_unit_config               |                1 | sys_pool                 | zone2 |         1 | sys         | 10.10.10.2 |     2882 |                     |                     0 |       5 |     2.5 | 16106127360 | 12884901888 |    10000 |     5000 |  179593805824 | 9223372036854775807 |
 |       3 |              1 | sys_unit_config               |                1 | sys_pool                 | zone3 |         1 | sys         | 10.10.10.3 |     2882 |                     |                     0 |       5 |     2.5 | 16106127360 | 12884901888 |    10000 |     5000 |  179593805824 | 9223372036854775807 |
 |    1001 |           1002 | config_mysql001_zone1_S1_egh  |             1001 | pool_mysql001_zone1_egh  | zone1 |      1001 | mysql001    | 10.10.10.1 |     2882 |                     |                     0 |     1.5 |     1.5 |  6442450944 |  6442450944 |     1250 |     1250 |  536870912000 |                 375 |
 |    1002 |           1001 | config_mysql001_zone3_S1_ryi  |             1002 | pool_mysql001_zone3_ryi  | zone3 |      1001 | mysql001    | 10.10.10.3 |     2882 |                     |                     0 |     1.5 |     1.5 |  6442450944 |  6442450944 |     1250 |     1250 |  536870912000 |                 375 |
 |    1003 |           1003 | config_mysql001_zone2_S1_jsl  |             1003 | pool_mysql001_zone2_jsl  | zone2 |      1001 | mysql001    | 10.10.10.2 |     2882 |                     |                     0 |     1.5 |     1.5 |  6442450944 |  6442450944 |     1250 |     1250 |  536870912000 |                 375 |
 |    1004 |           1004 | config_oracle001_zone2_S1_aul |             1004 | pool_oracle001_zone2_aul | zone2 |      1002 | oracle001   | 10.10.10.2 |     2882 |                     |                     0 |     1.5 |     1.5 |  6442450944 |  6442450944 |     1250 |     1250 |  536870912000 |                 375 |
 |    1005 |           1005 | config_oracle001_zone1_S1_sef |             1005 | pool_oracle001_zone1_sef | zone1 |      1002 | oracle001   | 10.10.10.1 |     2882 |                     |                     0 |     1.5 |     1.5 |  6442450944 |  6442450944 |     1250 |     1250 |  536870912000 |                 375 |
 |    1006 |           1006 | config_oracle001_zone3_S1_mfa |             1006 | pool_oracle001_zone3_mfa | zone3 |      1002 | oracle001   | 10.10.10.3 |     2882 |                     |                     0 |     1.5 |     1.5 |  6442450944 |  6442450944 |     1250 |     1250 |  536870912000 |                 375 |
 +---------+----------------+-------------------------------+------------------+--------------------------+-------+-----------+-------------+----------------+----------+---------------------+-----------------------+---------+---------+-------------+-------------+----------+----------+---------------+---------------------+
 9 rows in set
For more information about the
gv$unitview, see gv$unit.Tenants
 obclient> SELECT * FROM gv$tenant;
 +-----------+-------------+-------------------+-------------------+----------------+---------------+-----------+---------------------------------------------+
 | tenant_id | tenant_name | zone_list         | primary_zone      | collation_type | info          | read_only | locality                                    |
 +-----------+-------------+-------------------+-------------------+----------------+---------------+-----------+---------------------------------------------+
 |         1 | sys         | zone1;zone2;zone3 | zone1;zone2;zone3 |              0 | system tenant |         0 | FULL{1}@zone1, FULL{1}@zone2, FULL{1}@zone3 |
 |      1001 | mysql001    | zone1;zone2;zone3 | zone1;zone2;zone3 |              0 |               |         0 | FULL{1}@zone1, FULL{1}@zone2, FULL{1}@zone3 |
 |      1002 | oracle001   | zone1;zone2;zone3 | zone1;zone2;zone3 |              0 |               |         0 | FULL{1}@zone1, FULL{1}@zone2, FULL{1}@zone3 |
 +-----------+-------------+-------------------+-------------------+----------------+---------------+-----------+---------------------------------------------+
 3 rows in set
For more information about the
gv$tenantview, see gv$tenant.MemStore usage of each tenant
obclient> SELECT tenant_name,svr_ip,
    memstore_limit /(1024 * 1024 * 1024) as memstore_limit,
    major_freeze_trigger /(1024 * 1024 * 1024) as freeze_trigger_GB,
    total_memstore_used /(1024 * 1024 * 1024) as memstore_used_GB,
    concat((total_memstore_used * 100 / memstore_limit), '%') as memstore_used_percent,
    active_memstore_used /(1024 * 1024 * 1024) as active_memstore_used_GB,
    freeze_cnt
    FROM __all_virtual_tenant_memstore_info memstore_info
    inner join __all_tenant tenant on memstore_info.tenant_id = tenant.tenant_id
    ORDER BY tenant.tenant_name,svr_ip;
+-------------+----------------+----------------+-------------------+------------------+-----------------------+-------------------------+------------+
| tenant_name | svr_ip         | memstore_limit | freeze_trigger_GB | memstore_used_GB | memstore_used_percent | active_memstore_used_GB | freeze_cnt |
+-------------+----------------+----------------+-------------------+------------------+-----------------------+-------------------------+------------+
| mysql001    | 10.10.10.1     |         3.0000 |            2.1000 |           0.1133 | 3.7760%               |                  0.1113 |          0 |
| mysql001    | 10.10.10.2     |         3.0000 |            2.1000 |           0.1133 | 3.7760%               |                  0.1113 |          0 |
| mysql001    | 10.10.10.3     |         3.0000 |            2.1000 |           0.1230 | 4.1016%               |                  0.1210 |          0 |
| oracle001   | 10.10.10.1     |         3.0000 |            2.1000 |           0.1133 | 3.7760%               |                  0.1113 |          0 |
| oracle001   | 10.10.10.2     |         3.0000 |            2.1000 |           0.1133 | 3.7760%               |                  0.1113 |          0 |
| oracle001   | 10.10.10.3     |         3.0000 |            2.1000 |           0.1250 | 4.1667%               |                  0.1230 |          0 |
| sys         | 10.10.10.1     |         7.5000 |            5.2500 |           0.3652 | 4.8698%               |                  0.3631 |          0 |
| sys         | 10.10.10.2     |         7.5000 |            5.2500 |           0.3594 | 4.7917%               |                  0.3573 |          0 |
| sys         | 10.10.10.3     |         7.5000 |            5.2500 |           0.3750 | 5.0000%               |                  0.3729 |          0 |
+-------------+----------------+----------------+-------------------+------------------+-----------------------+-------------------------+------------+
9 rows in set
Check the overview of a tenant and its resource unit specifications in the OCP console
Prerequisites
You have all permissions on the specified cluster and the management permissions on its tenants. Otherwise, request the administrator to assign the required role. For more information, see "Edit a user" in the OCP User Guide of the corresponding version.
Check the tenant management overview
Log on to the OCP console. The Clusters page automatically appears.
In the Clusters list, find the target cluster and click its name.
In the left-side navigation pane of the page that appears, click Tenant Management.
On the Tenant Management page, view the following information:
Resource distribution information in the upper part of the Tenant Management page.
The resource distribution information includes the percentage of CPU and memory usage of each tenant, and the percentage of the remaining CPU and memory of the system.
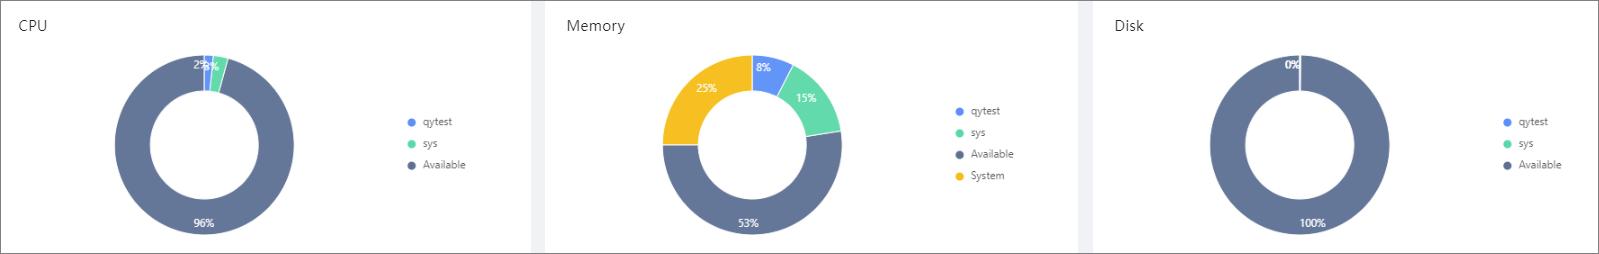
When you move the pointer over the pie chart, the system displays the resource usage of the tenant.
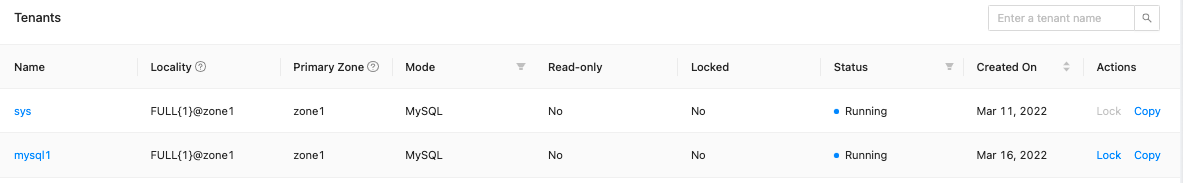
In the Tenants section, you can view the basic information of all tenants, such as the tenant name, replica type, zone priority, tenant mode, and status.
In the Top 5 Tenants section, you can view the performance metrics of the top 5 tenants by workload, such as the TPS, QPS, SQL response time, transaction response time, number of active sessions, number of waits, wait time, capacity_number of tables, and capacity_number of partitions.
You can also view the monitoring information during the last hour, day, or week as needed.
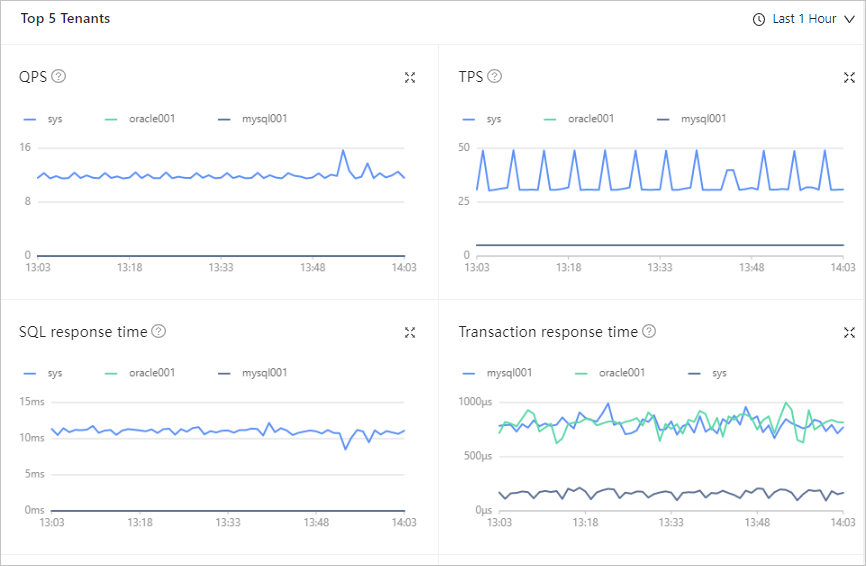
The following table describes the performance monitoring metrics.
MetricDescriptionSourceQPS The average number of SQL statements processed per second. v$sysstatTPS The average number of transactions processed per second. v$sysstatSQL response time The SQL response time, in μs. v$sysstatTransaction response time The average time taken by the server to process a transaction, in µs. v$sysstatNumber of active sessions The number of active sessions in this tenant. __all_virtual_processlistEvent waiting_count The average number of waiting events per second. v$system_eventEvent waiting_time The average wait time of each wait event, in μs. v$system_eventCapacity_tables The number of tables. gv$tableCapacity_partitions The number of partitions. v$partition
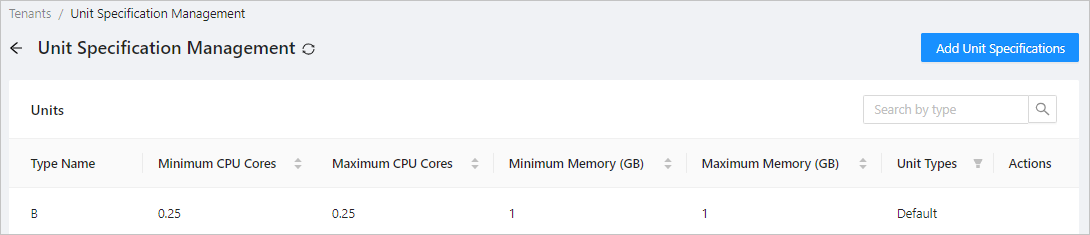
Check the unit specifications
Log on to the OCP console.
In the left-side navigation pane, click Tenants.
On the page that appears, click Unit Specification Management in the upper-right corner. Then, the Unit Specification Management page appears.
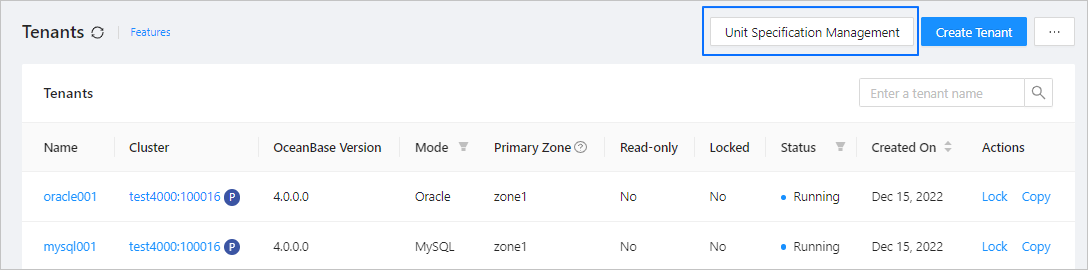
View units in the unit list that contains the following columns: Type Name, Minimum CPU Cores, Maximum CPU Cores, Minimum Memory (GB), Maximum Memory (GB), Unit Type, and Actions.
You can sort the unit types by minimum CPU cores, maximum CPU cores, minimum memory (GB), or maximum memory (GB).
You can filter the unit specifications by unit type. The unit types supported are default and custom.
In the Actions column, you can click Modify or Delete.
Note
You can only modify or delete a unit that is created by yourself.