This topic describes how to view the information about an OceanBase cluster such as basic information, zones, and nodes of the cluster by using the command line tool or in the OceanBase Cloud Platform (OCP) console.
View cluster information by using the command line tool
Log on to the
systenant as therootuser.[root@xxxx ~]# obclient -h10.10.10.1 -P2881 -uroot@sys -p -A Enter password: Welcome to the OceanBase monitor. Commands end with ; or \g. Your OceanBase connection id is 3221487637Access the database named
oceanbase.obclient> use oceanbase; Database changedView cluster information from a view.
Execute the following statement to view the ID, name, and creation time of the cluster in the v$ob_cluster view:
obclient> SELECT * FROM v$ob_cluster\G
*************************** 1. row ***************************
                cluster_id: 14
              cluster_name: test3232
                   created: 2022-09-08 14:43:27.254167
              cluster_role: PRIMARY
            cluster_status: VALID
               switchover#: 0
         switchover_status: NOT ALLOWED
           switchover_info: NONE SYNCED STANDBY CLUSTER
               current_scn: 1662620251109247
standby_became_primary_scn: 0
        primary_cluster_id: NULL
           protection_mode: MAXIMUM PERFORMANCE
          protection_level: MAXIMUM PERFORMANCE
    redo_transport_options: ASYNC NET_TIMEOUT = 30000000
1 row in set
Execute the following statement to view information about all zones in the cluster in the
__all_zoneview:obclient> SELECT * FROM __all_zone WHERE name='idc'; +----------------------------+----------------------------+-------+------+-------+------+ | gmt_create | gmt_modified | zone | name | value | info | +----------------------------+----------------------------+-------+------+-------+------+ | 2022-09-08 14:43:39.940623 | 2022-09-08 14:44:04.161923 | zone1 | idc | 0 | HZ0 | | 2022-09-08 14:43:39.942688 | 2022-09-08 14:44:04.169328 | zone2 | idc | 0 | HZ0 | | 2022-09-08 14:43:39.943735 | 2022-09-08 14:44:04.175624 | zone3 | idc | 0 | HZ0 | +----------------------------+----------------------------+-------+------+-------+------+ 3 rows in setThe following table describes the fields.
FieldDescriptiongmt_create The time when the cluster was created. gmt_modified The time when the cluster was last updated. zone The name of the zone. name The name of the information item. value The value of the information item. info The string that represents the information value. You can execute the following statement to query the
__all_serverview and learn about the information of all OBServer nodes in the cluster, such as their IP addresses, service ports, internal communication ports, zones, and status.obclient> SELECT id,svr_ip,svr_port,zone,inner_port,with_rootserver,status,start_service_time,last_offline_time FROM __all_server; +----+----------------+----------+-------+------------+-----------------+--------+--------------------+-------------------+ | id | svr_ip | svr_port | zone | inner_port | with_rootserver | status | start_service_time | last_offline_time | +----+----------------+----------+-------+------------+-----------------+--------+--------------------+-------------------+ | 1 | 10.10.10.1 | 2882 | zone3 | 2881 | 1 | active | 1662619523361997 | 0 | | 2 | 10.10.10.2 | 2882 | zone2 | 2881 | 0 | active | 1662619523371177 | 0 | | 3 | 10.10.10.3 | 2882 | zone1 | 2881 | 0 | active | 1662619523366233 | 0 | +----+----------------+----------+-------+------------+-----------------+--------+--------------------+-------------------+ 3 rows in setThe following table describes the fields.
FieldDescriptionid The ID of the node. svr_ip The IP address of the node. svr_port The port number of the node. zone The name of the zone. inner_port The port for SQL execution. with_rootserver Specifies whether RS is deployed on the OBServer node. status The status of the OBServer node. Valid values: - active: The OBServer node is running properly.
- inactive: The OBServer node failed.
- deleting: The OBServer node is being deleted.
start_service_time The time in point when the OBServer node started running. last_offline_time The time in point when the OBServer node was last removed. Execute the following statement to query the
__all_virtual_server_statview and learn about the resource usage of the cluster:obclient> SELECT zone, concat(svr_ip, ':', svr_port) observer, cpu_capacity, cpu_total, cpu_assigned, cpu_assigned_percent, mem_capacity, mem_total, mem_assigned, mem_assigned_percent, unit_Num, round(`load`, 2) `load`, round(cpu_weight, 2) cpu_weight, round(memory_weight, 2) mem_weight, leader_count FROM __all_virtual_server_stat ORDER BY zone,svr_ip; +-------+---------------------+--------------+-----------+--------------+----------------------+--------------+-------------+--------------+----------------------+----------+------+------------+------------+--------------+ | zone | observer | cpu_capacity | cpu_total | cpu_assigned | cpu_assigned_percent | mem_capacity | mem_total | mem_assigned | mem_assigned_percent | unit_Num | load | cpu_weight | mem_weight | leader_count | +-------+---------------------+--------------+-----------+--------------+----------------------+--------------+-------------+--------------+----------------------+----------+------+------------+------------+--------------+ | zone1 | 10.10.10.1:2882 | 62 | 62 | 5.5 | 8 | 53687091200 | 53687091200 | 25769803776 | 48 | 3 | 0.42 | 0.16 | 0.84 | 1585 | | zone2 | 10.10.10.2:2882 | 62 | 62 | 5.5 | 8 | 53687091200 | 53687091200 | 25769803776 | 48 | 3 | 0.42 | 0.16 | 0.84 | 0 | | zone3 | 10.10.10.3:2882 | 62 | 62 | 5.5 | 8 | 53687091200 | 53687091200 | 25769803776 | 48 | 3 | 0.42 | 0.16 | 0.84 | 0 | +-------+---------------------+--------------+-----------+--------------+----------------------+--------------+-------------+--------------+----------------------+----------+------+------------+------------+--------------+ 3 rows in set
View the cluster topology in the OCP console
OCP provides a topology diagram that allows you to view the logical relationships between zones and OBServer nodes in a cluster or tenant.
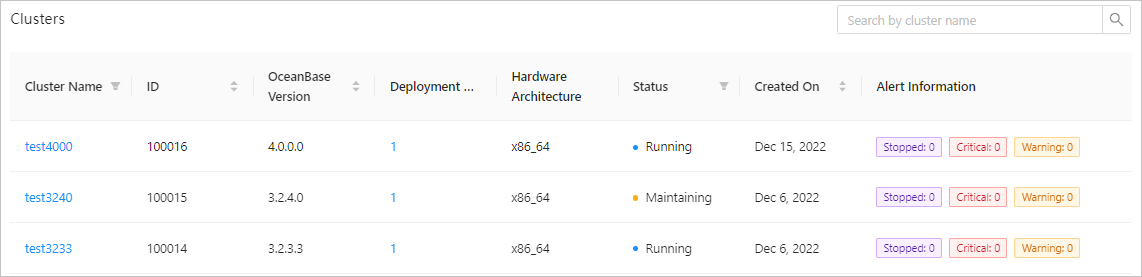
Log on to the OCP console. In the Clusters list on the Clusters page, find the target cluster and click its name.
In the left-side navigation pane of the Overview page, click Topology.
The cluster topology allows you to perform the following operations:
You can see the protection mode information in the upper-left corner of the page.
If the cluster is a standby cluster, you can view the synchronization status on the top of the standby cluster.
You can use the functional buttons in the upper-right corner of the page to resize or refresh the topology.
The cluster topology consists of three layers from top to bottom: cluster, zone, and server. You can click + beneath the zone to show all servers in the zone.
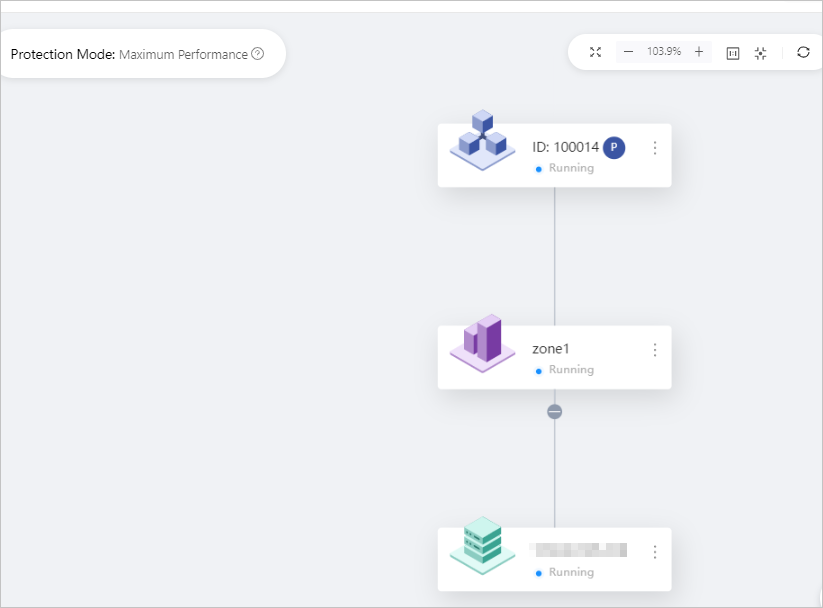
Cluster
The ID, type, and current status of the OceanBase cluster is displayed next to the cluster icon, where the type can be primary or standby.
In the case of a standby cluster, you can also see its latency next to the cluster icon.
The topology also provides some cluster management options.
For a primary cluster, you can create a backup cluster, add a zone, add an OBServer node, upgrade the version, change the password, and restart, stop or delete the cluster.
For a standby clusters, you can perform operations such as viewing the cluster and switching to the primary role.
Zone
The name and current status of a zone are displayed next to the zone icon.
You can move the pointer over a zone icon to view information about the zone, such as the QPS, number of connections, and number of units.

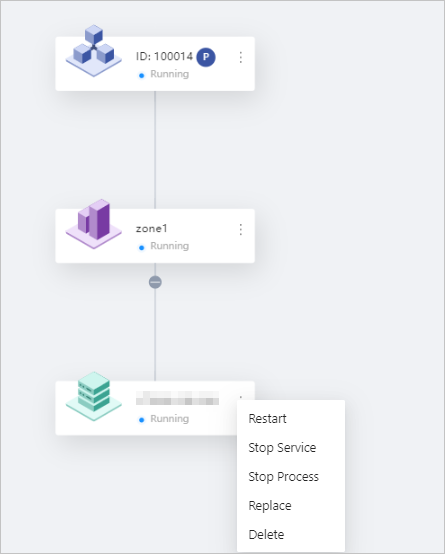
OBServer node
The IP address and current status of an OBServer node are displayed next to the node icon.
You can hover the pointer over a node icon to view the information about the OBServer node, such as the QPS, number of connections, and SQL ports.
The topology also provides some server management features that allow you to restart and stop a server, and stop a process.