


OceanBase Cloud Platform (OCP) provides multiple performance monitoring metrics for the administrator to check the performance of databases and servers in a cluster.
Procedure
Log on to the OCP console. The Clusters page automatically appears.
In the Clusters list, find the target cluster and click its name.
In the left-side navigation pane on the page that appears, click Performance Monitoring.
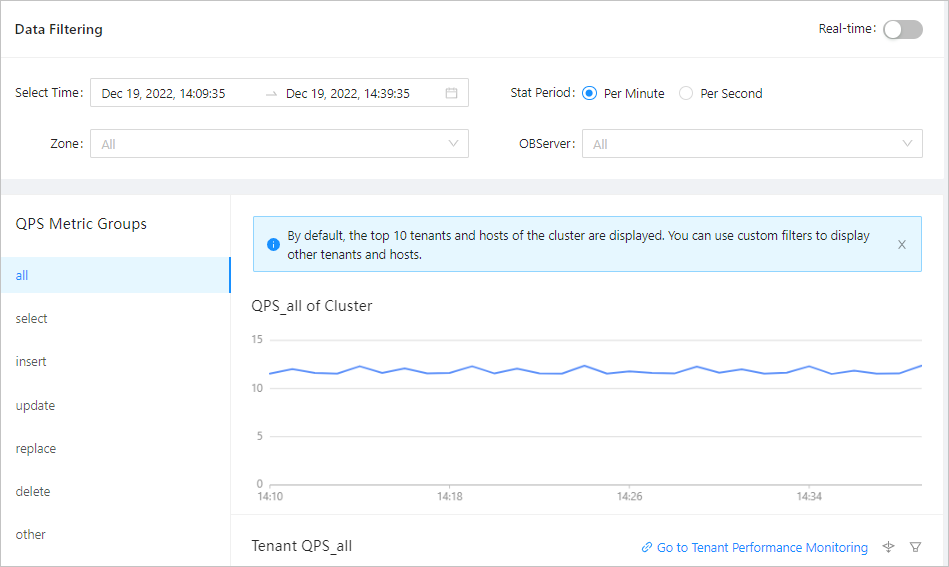
In the Data Filtering section, select filter conditions.
The following table describes the filter conditions.
ConditionDescriptionSelect Time (not displayed in real-time mode) Select a time range for the data that you want to query. Stat Period (not displayed in real-time mode) Select the statistical period for each data point. Valid values: Per Minute and Per Second, which respectively mean one data point per minute and one data point per second. OCP also calculates one more statistical period based on the selected time range to make the number of data points returned approximate 1,440. If the selected time range is long, the statistical period may be longer than one minute. Zone Select the zone that you want to view. OBServer Select the OBServer node that you want to view. After you specify the filter conditions, the system displays the performance metrics of the cluster based on the specified values of Select Time and Stat Period.
To view the performance metrics of an OBServer node in real time, toggle on the Real-time switch in the upper-right corner and select the target OBServer node.
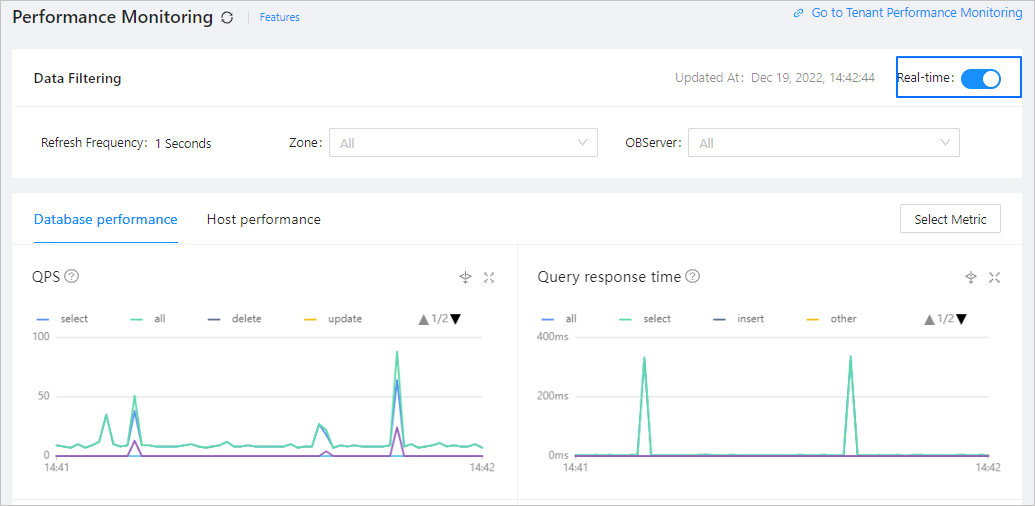
You can respectively view the performance metrics of databases and hosts in the cluster on different tabs.
Click the Database Performance tab to view the database performance.
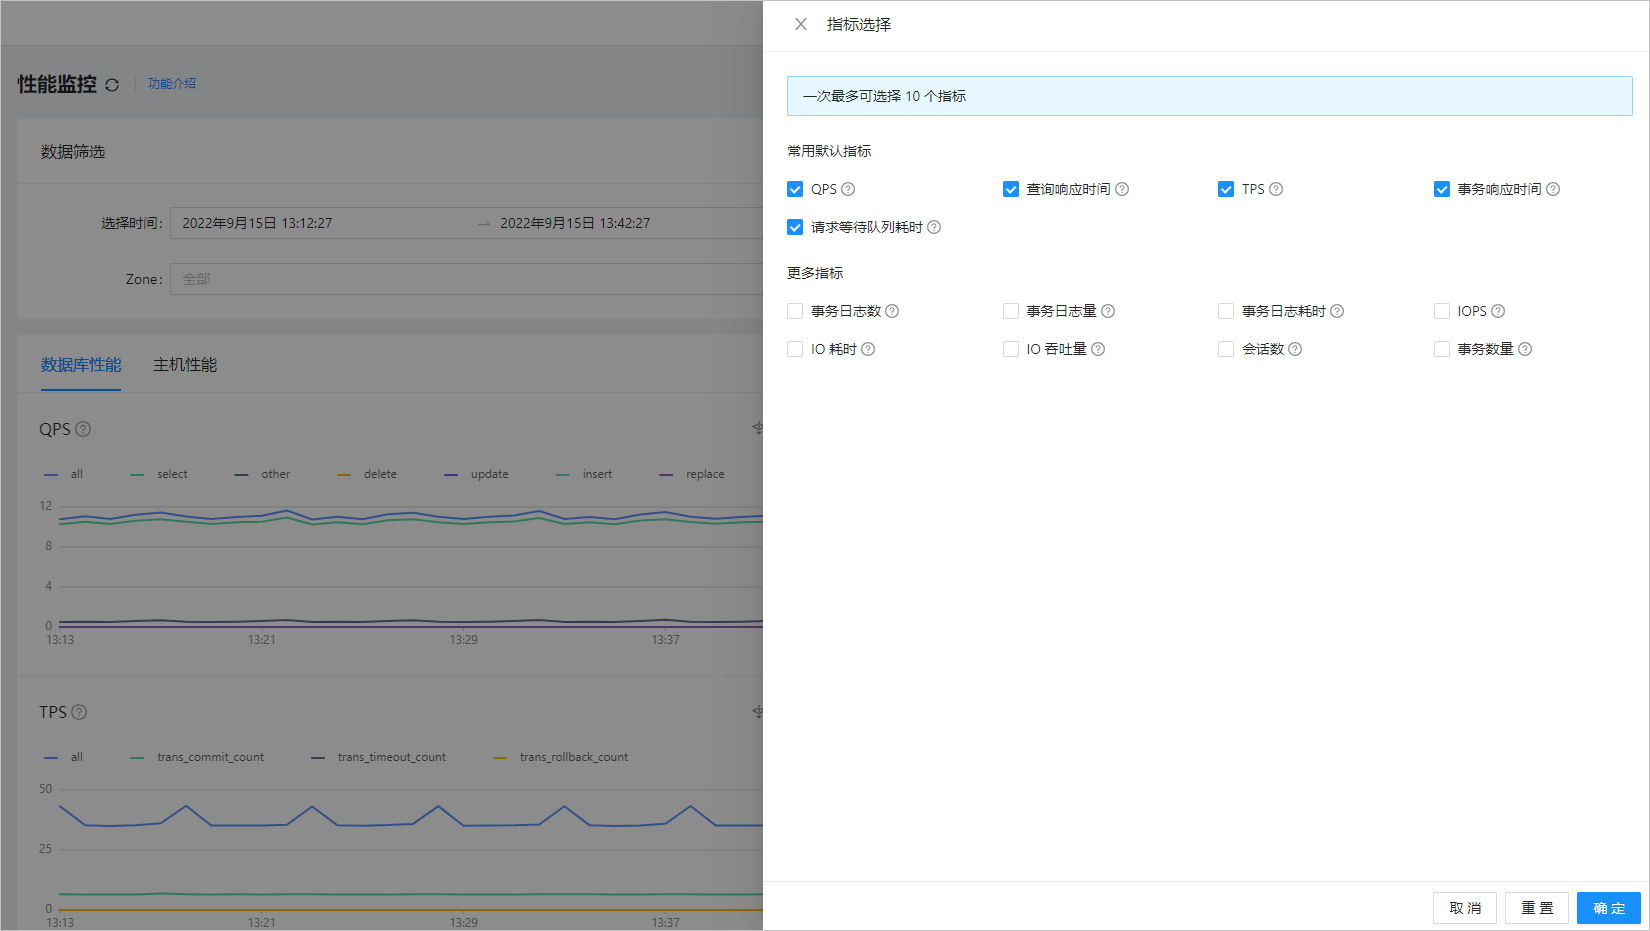
To display other metrics, click Select Metric on the right side and select the metrics that you want to display. The system can display up to 10 metrics.
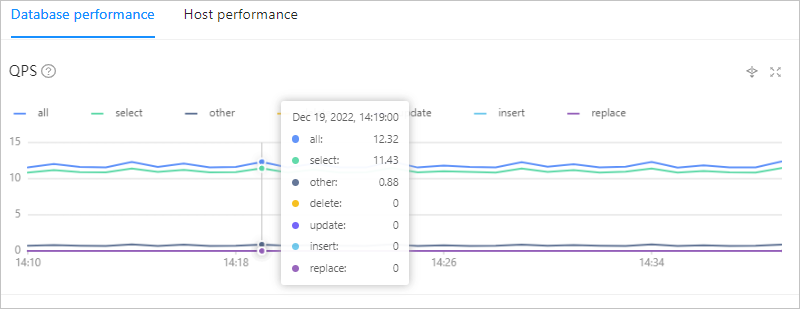
Hide the data of a submetric. To use this feature, click the icon of the submetric. The submetric will then turn gray and its data will be hidden from the chart.
View data at a specific point in time. To use this feature, move the pointer over this point in time on the trend chart.
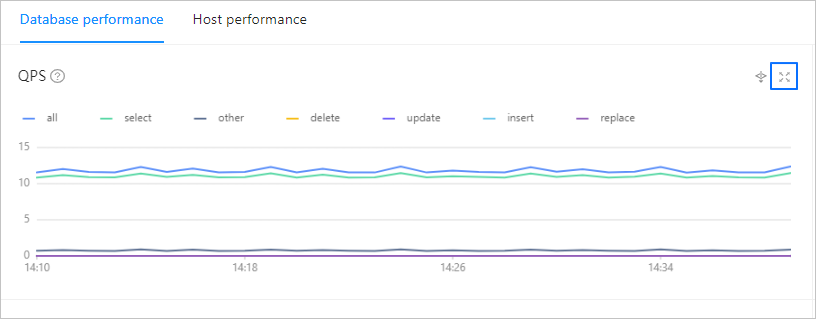
Zoom in on the trend chart. To use this feature, click the zoom-in icon in the upper-right corner.
To view monitoring data in different dimensions, perform a drill-down analysis. When an abnormal metric exists, such as the long response time of a tenant, perform a drill-down analysis to identify the faulty server. To use this feature, click the Drill-down Analysis icon in the upper-right corner of the trend chart.

Click the Host Performance tab to view the host performance.
For more information about database and host performance metrics, see the OCP User Guide of the corresponding version.