This topic describes how to view details of an SQL statement in OceanBase Cloud Platform (OCP), including its execution status, execution plans, bound indexes, and throttling enabling status.
Prerequisites
The version of OceanBase Database is later than 3.0 so that you can view the SQL statement execution profile.
For a tenant in MySQL mode, the password box of the OCP user must contain the password of the tenant.
For a tenant in Oracle mode, the password box of the OCP user must contain the password of the SYS tenant in the cluster.
Note
To bind indexes and plans and configure throttling, the user logged on to the tenant of the OCP console must have the UPDATE privilege on the tenant.
Go to the details page of an SQL statement
In the left-side navigation pane, click Tenants and click the target tenant in the Tenants list to go to the Overview page of the tenant.
In the left-side navigation pane, click SQL Diagnostics to go to the SQL Diagnostics page.
On the TopSQL or SlowSQL tab, find the target SQL statement.
You can specify search criteria to find the target SQL statement.
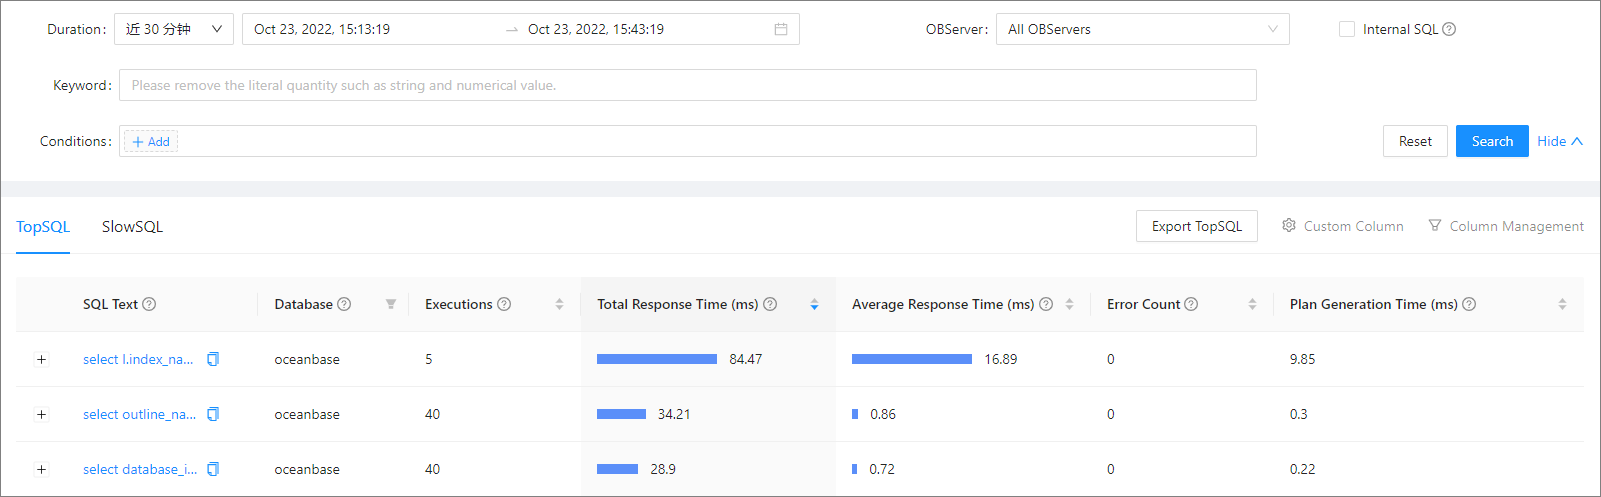
Click the SQL text of the target SQL statement to go to the details page of the SQL statement.
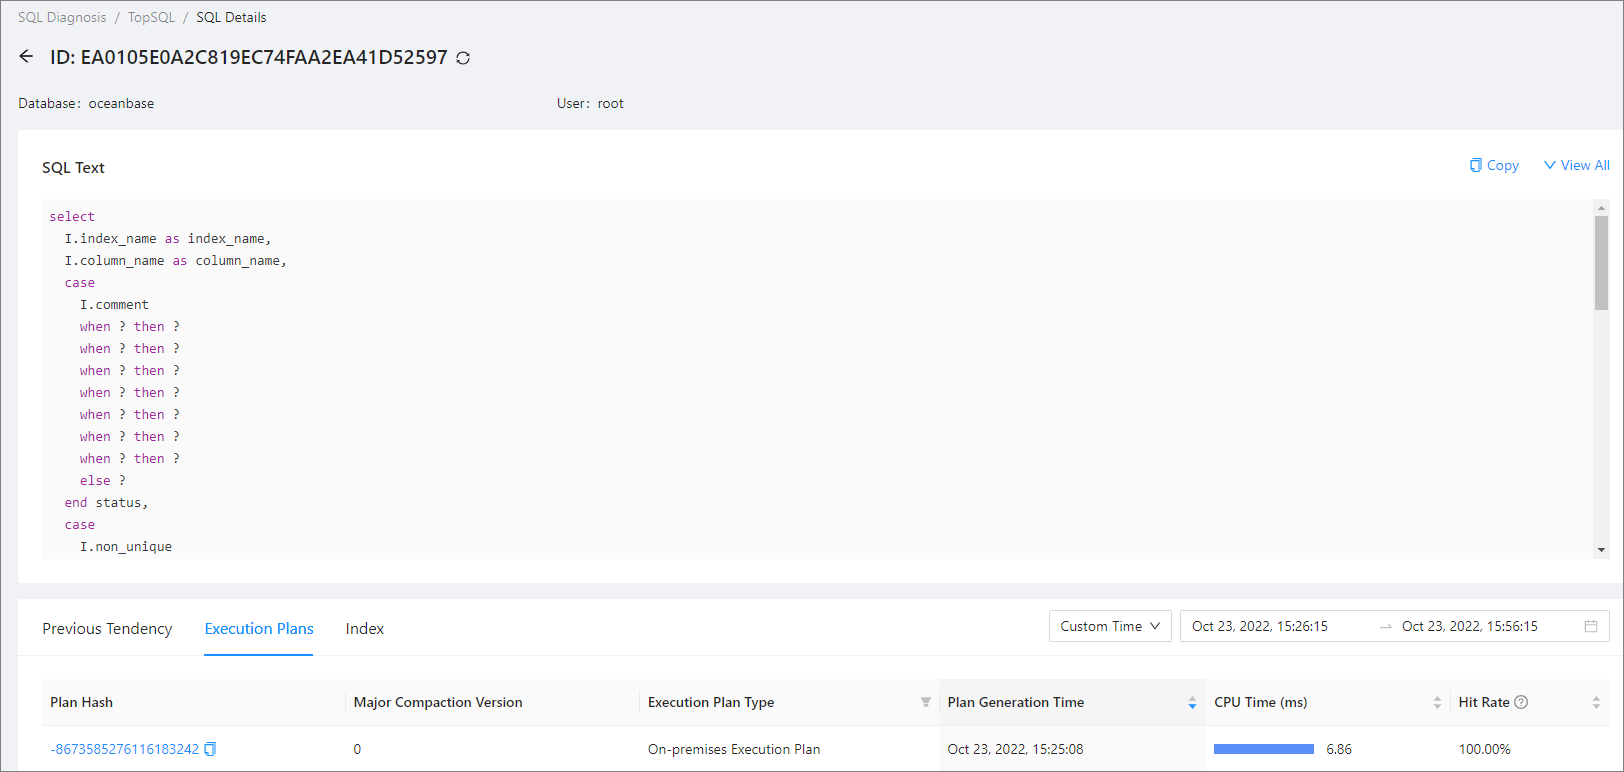
On the SQL Details page, you can view the following details of the SQL statement:
In the SQL Text section, you can view the complete SQL statement. OCP masks sensitive data in the SQL statement. However, if OCP failed to parse the SQL statement, it returns the original SQL statement.
On the Previous Tendency tab, you can view the historical trends of the SQL statement. For more information, see View the historical trends of an SQL statement.
On the Execution Plans tab, you can view the execution plans of the SQL statement. For more information, see View the execution plans of an SQL statement.
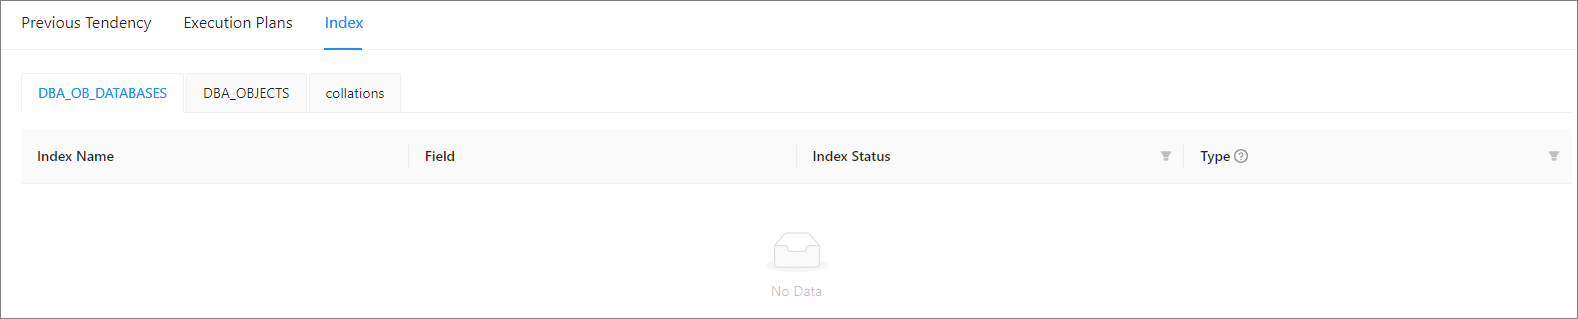
On the Index tab, you can view the indexes bound to the SQL statement. For more information, see View and bind indexes.
View the historical trends of an SQL statement
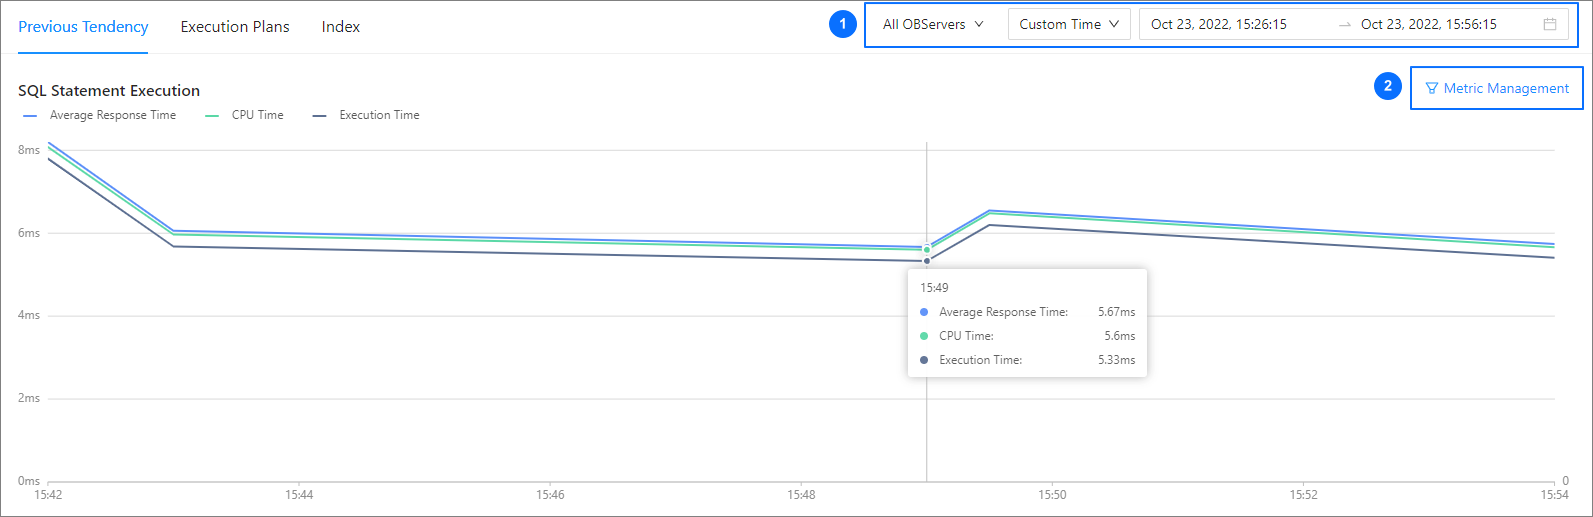
On the SQL Details page, click the Previous Tendency tab.
You can view the SQL Statement Execution and SQL Plan Generation Time charts on this tab. When you modify the statistical time in section ① of the figure, both of the charts will be updated based on the new time.
SQL Statement Execution chart
By default, this chart displays Average Response Time , CPU Time , and Execution Time . You can select more metrics to display in section ② of the figure.
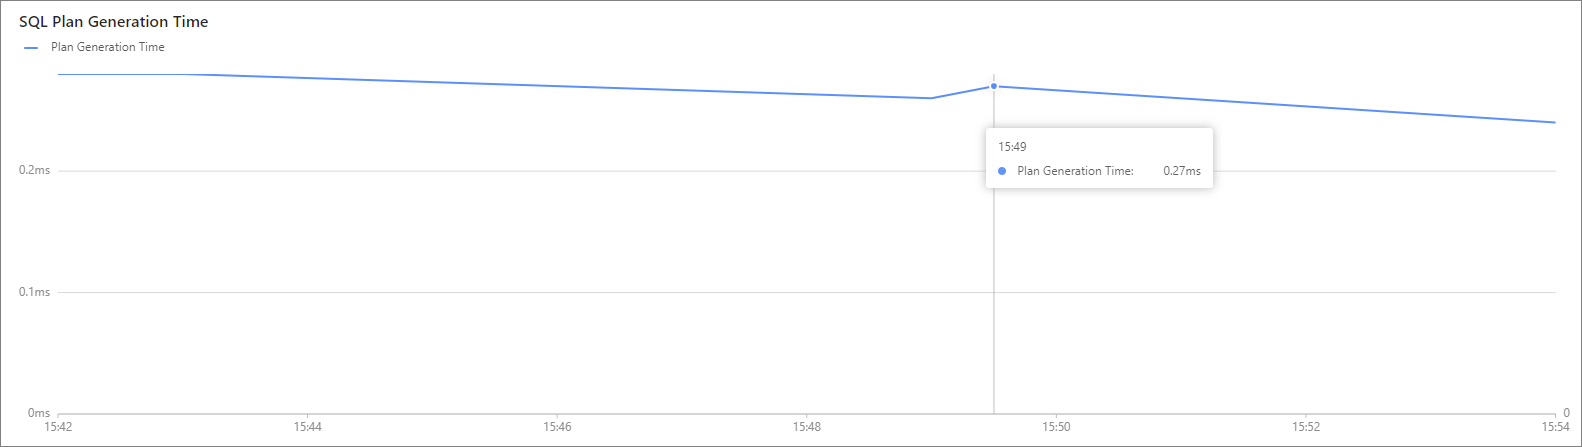
SQL Plan Generation Time chart
This chart indicates that a new plan is generated. The time used to generate the plan is represented by the y-axis.
View the execution plans of an SQL statement
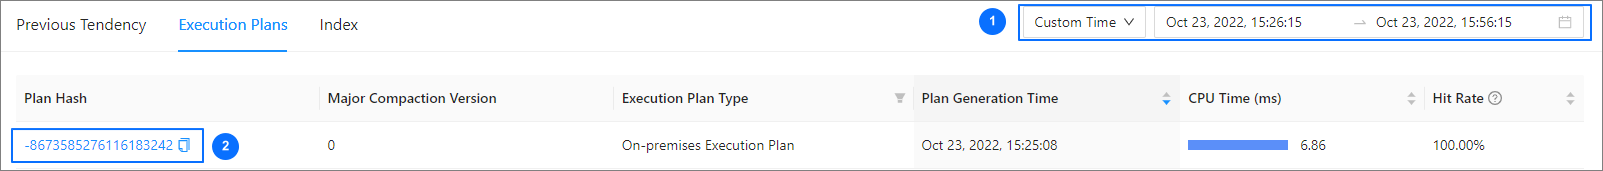
On the SQL Details page, click the Execution Plans tab. On this tab, you can perform the following operations:
Set the range and time window for query in section ①.
Click the value in section ② to view the details of the execution plan, including basic information, execution steps, and execution records on different OBServers.
View index
On the SQL Details page, click the Index tab. On this tab, you can View the list of indexes. You can also create indexes by using a command-line tool or in OceanBase Developer Center (ODC).