


This topic describes how to view details of an SQL statement in OceanBase Cloud Platform (OCP), including its execution status, execution plans, bound indexes, and throttling enabling status.
Prerequisites
The version of OceanBase Database is later than 3.0 so that you can view the SQL statement execution profile.
For a tenant in MySQL mode, the password box of the OCP user must contain the password of the tenant.
For a tenant in Oracle mode, the password box of the OCP user must contain the password of the SYS tenant in the cluster.
Note
To bind indexes and plans and configure throttling, the user logged on to the tenant of the OCP console must have the UPDATE privilege on the tenant.
Go to the details page of an SQL statement
In the left-side navigation pane, click Tenants and click the target tenant in the Tenants list to go to the Overview page of the tenant.
In the left-side navigation pane, click SQL Diagnostics to go to the SQL Diagnostics page.
On the Suspected SQL , TopSQL , SlowSQL , or ParallelSQL tab, find the target SQL statement.
You can specify search criteria to find the target SQL statement.
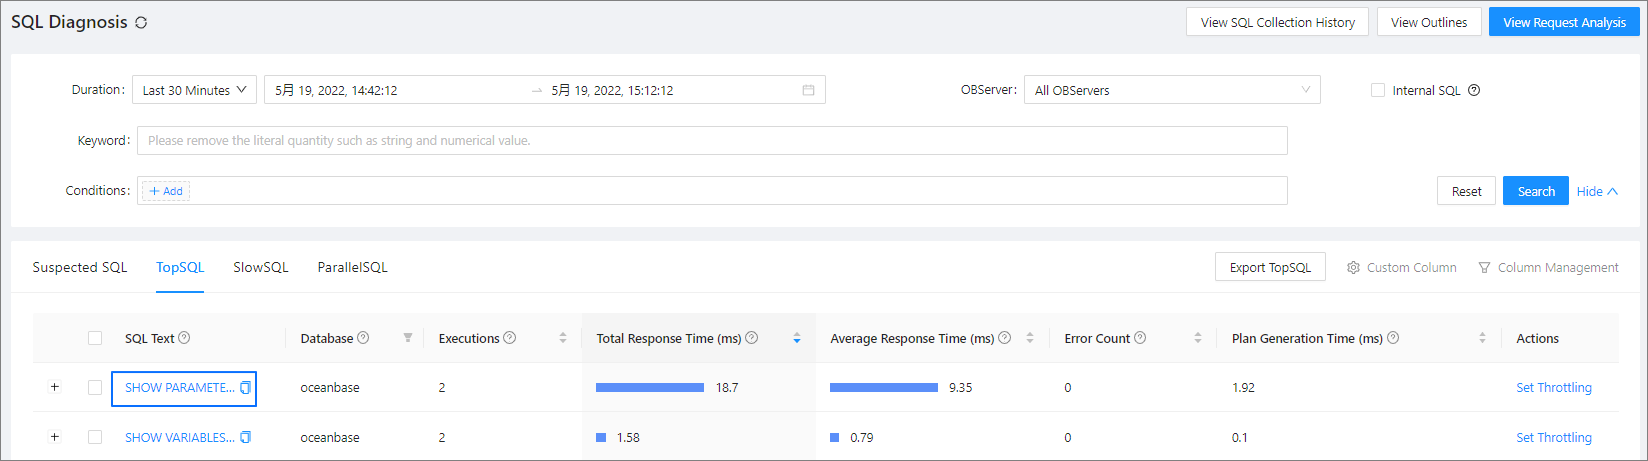
Click the SQL text of the target SQL statement to go to the details page of the SQL statement.
On the SQL Details page, you can view the following details of the SQL statement:
In the SQL Text section, you can view the complete SQL statement. OCP masks sensitive data in the SQL statement. However, if OCP failed to parse the SQL statement, it returns the original SQL statement.
In the Optimization Suggestions section, you can view the optimization suggestions for the SQL statement. For more information, see View optimization suggestions.
In the SQL Execution Profile section, you can view the execution details of the SQL statement. For more information, see View the execution profile of an SQL statement.
On the Previous Tendency tab, you can view the historical trends of the SQL statement. For more information, see View the historical trends of an SQL statement.
On the Execution Plans tab, you can view the execution plans of the SQL statement, or bind an execution plan to the statement. For more information, see View the execution plans of an SQL statement.
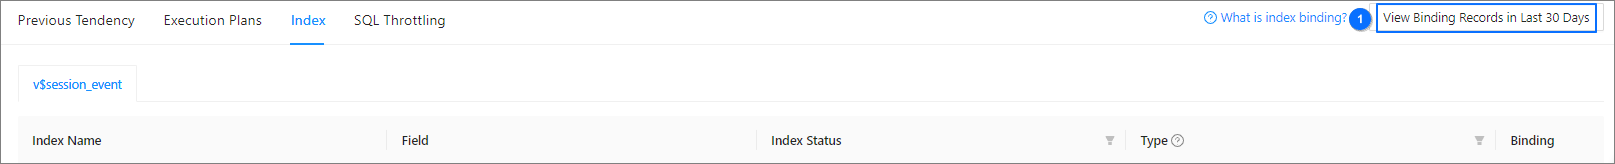
On the Index tab, you can view the indexes bound to the SQL statement. For more information, see View and bind indexes.
On the SQL Throttling tab, you can view or set throttling of the SQL statement. For more information, see Set SQL throttling.
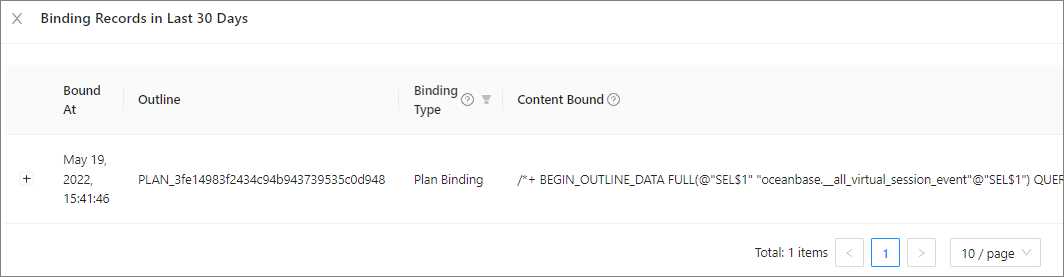
You can view the binding records of the SQL statement in section ① as illustrated on the Execution Plans , Index , and SQL Throttling tabs.
In the binding records, you can view the status of a bound execution plan, or click Unbind to unbind the plan from the SQL statement. You can click Bind Plan to bind the plan to the SQL statement again.
View optimization suggestions
If the SQL diagnostics identifies a change in the execution plan or performance of an SQL statement or identifies an excessively long response time of the SQL statement, you can view the problems and solutions in the Optimization Suggestions section. This section provides index creation recommendation, historical plan recommendation, and CPU scale-out recommendation. You can also view the plan hash and diagnostic details, and bind execution plans.
The index creation suggestions are provided based on the parsing of the queried columns of the SQL statement. The equality query columns are sorted in descending order of the number of distinct values (NDVs), and the range query columns are sorted in ascending order of scan ranges.
A historical execution plan whose average CPU time is 20% lower than that of execution plans of the same type (local or distributed) of the SQL statement executed in the last 7 days is identified through analysis and recommended.
If the CPU utilization of the tenant is greater than 60%, the system recommends that you scale out the CPU capacity for the tenant.
Note
You can view the diagnostic details of only suspicious SQL statements.
View details of an execution plan
Click View Plan Hash . In the dialog box that appears, you can view the details of the execution plan, including the basic information, execution steps, and server execution plans.
Bind an execution plan
Click Bind Execution Plan . In the dialog box that appears, click Bind . After the execution plan is bound, refresh the page, and click View Binding Records in Last 30 Days to confirm that the execution plan is bound.
View diagnostic details
Click View Diagnostic Details to view the diagnostic details of a suspicious SQL statement.
View the execution profile of the SQL statement
The SQL Execution Profile section displays the operator-level execution details of the SQL statement, including the trace ID, degree of parallelism, request time, response time, and operations. Note
You can view the execution profiles of only ParallelSQL statements.
View details on the Trace Details page
Click a trace ID to go to the Trace Details page and view the execution profile, including the basic information of the trace, schema table, schema index, OBServer node details, and operator execution details.
Click Download Execution Profile Report in the upper-right corner of the page to export the trace information as an HTML file.
Click the triangular icon at the right side of the trace ID to switch to another trace.
On the Schema Table tab, click the table creation statement to view the details of the statement.
On the Schema Index tab, bind or unbind indexes.
Download the execution profile report
In the SQL Execution Profile section, click Download Execution Profile Report in the Actions column of the target trace to export the trace information as an HTML file.
View the historical trends of an SQL statement
On the SQL Details page, click the Previous Tendency tab.
You can view the SQL Statement Execution and SQL Plan Generation Time charts on this tab. When you modify the statistical time in section ① of the figure, both of the charts will be updated based on the new time.
SQL Statement Execution chart
By default, this chart displays Average Response Time , CPU Time , and Execution Time . You can select more metrics to display in section ② of the figure.

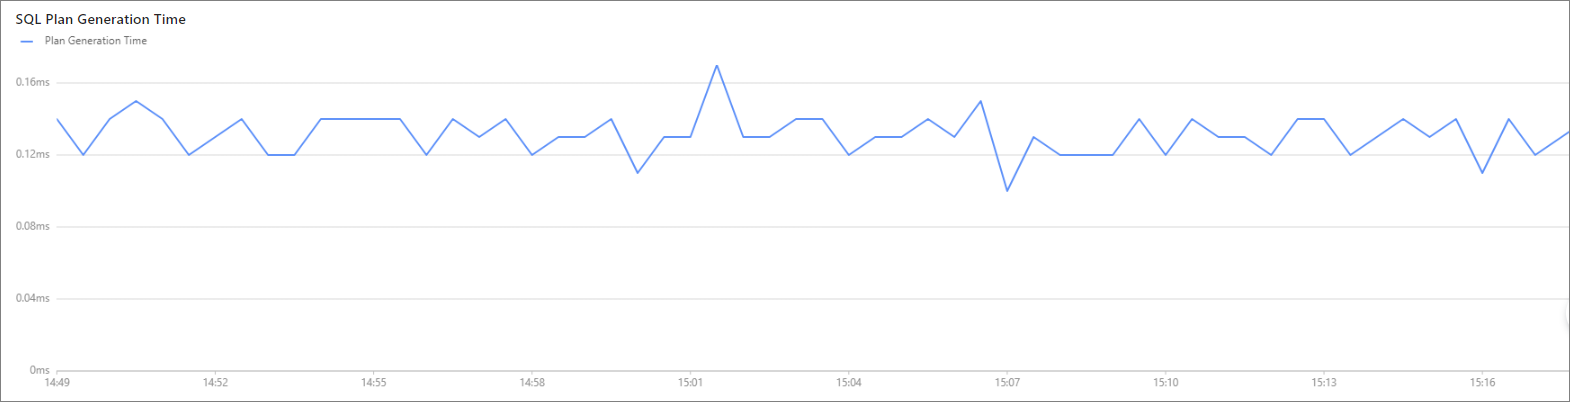
SQL Plan Generation Time chart
This chart indicates that a new plan is generated. The time used to generate the plan is represented by the y-axis.
View the execution plans of an SQL statement
On the SQL Details page, click the Execution Plans tab. On this tab, you can perform the following operations:
Set the range and time window for query in section ①.
Click the button in section ② to view the execution plan binding records of the SQL statement in the last 30 days.
Click the value in section ③ to view the details of the execution plan, including basic information, execution steps, and execution records on different OBServers.
Click Bind to bind the execution plan to the SQL statement.

View and bind indexe
On the SQL Details page, click the Index tab. On this tab, you can perform the following operations:
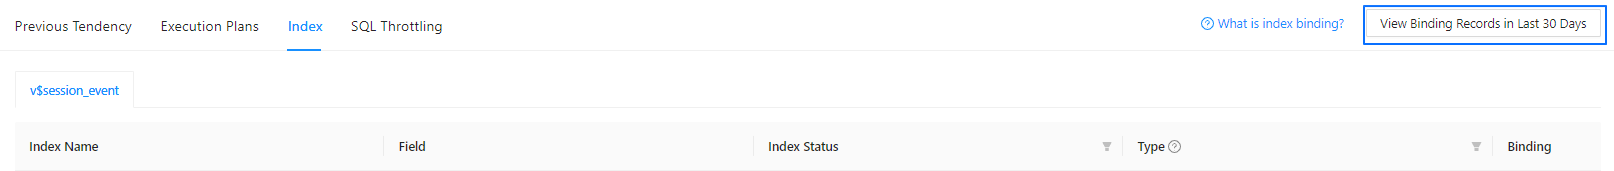
View the list of indexes bound to the SQL statement.
You can filter the indexes by indexing status and type. You can also click Bind to bind the index to the SQL statement. You can create indexes by using a command-line tool or in OceanBase Developer Center (ODC).
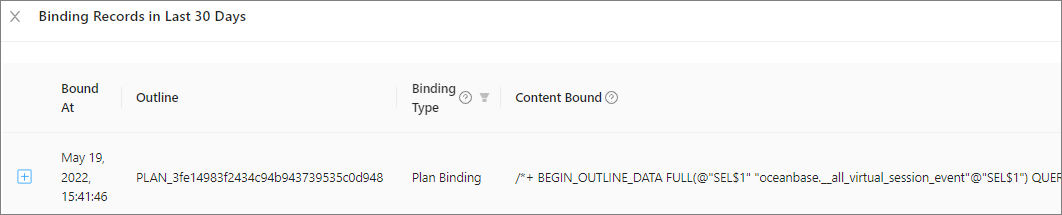
Click View Binding Records in Last 30 Days to view the index binding records of the SQL statement in the last 30 days.
In a binding record, you can view the status of the bound index, or click Unbind to unbind the index from the SQL statement. You can click Bind Plan to bind the index to the SQL statement again.
Set throttling for the SQL statement
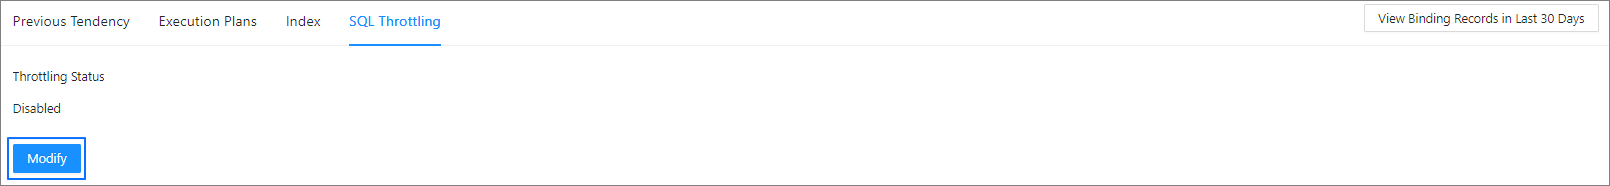
On the SQL Details page, click the SQL Throttling tab. On this tab, you can perform the following operations:
Check whether the current SQL statement is throttled.
The following figure shows that the SQL statement is not throttled.
Set throttling for the current SQL statement.
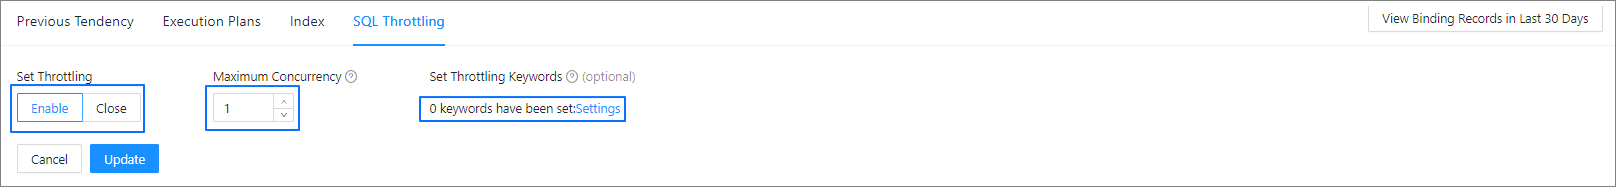
As shown in the preceding figure, enable throttling and specify the throttling strategy.
Maximum Concurrency: The value range is [0,+∞), and 0 indicates that throttling is disabled.
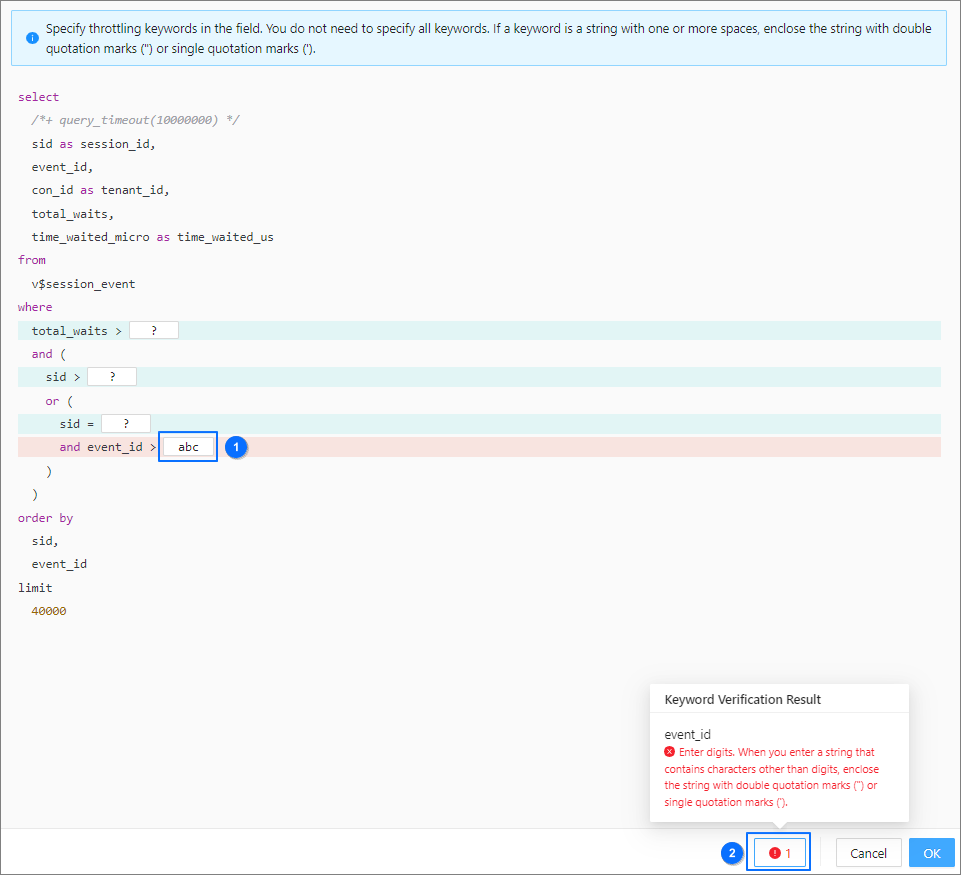
Throttling Keywords: Click Settings . In the Set Throttling Keywords dialog box, specify the throttling keywords in section ① in the figure.
Note
If no keywords are specified, the entire SQL statement is throttled.
- Click Update , and then click OK in the dialog box that appears.