


This topic describes how to troubleshoot replica migration issues in OceanBase Database.
Applicable versions
The solution provided in this topic is applicable to all versions of OceanBase Database.
Symptom
During the management and O&M of OceanBase clusters, you can use OceanBase Cloud Platform (OCP) or SQL statements to migrate replicas. If the migration operation fails, migration tasks fail to start, or migration errors occur, you must identify the causes and resolve the issues.
Troubleshooting logic
First, determine whether the replica migration meets the expectation. Then, take further actions based on the actual migration status.
Determine whether replica migration meets the expectation
Identify the abnormal partition.
Regardless of the way to initiate the replica migration task, you must identify the abnormal partition first. You can identify the abnormal partition in different ways based on business scenarios.
a. Check whether resource unit migration is in progress. After you execute the following statement, if a non-empty result is returned, resource unit migration is in progress.
SELECT * FROM __all_unit WHERE migrate_FROM_svr_ip != "" or migrate_FROM_svr_port != "";b. Execute the following statement to obtain the partition key to be migrated.
unit_idindicates theunit_idvalue of the previous query.svr_ipindicates themigrate_FROM_svr_ipvalue of the previous query.SELECT * FROM __all_virtual_partition_table WHERE unit_id = xxx and svr_ip = "yyy";Check whether RootService is properly scheduling the replica migration task.
Run the
grep "root_balancer" rootservice.logcommand on the server that runs RootService to obtain the thread ID (LWP_ID). Then, run thegrep "LWP_ID" rootservice.logcommand to query the task that is being executing by the load balancing thread of RootService. Alternatively, you can perform the following steps:a. View the status of the migration task.
Externally initiated commands are recorded in the
__all_rootservice_jobtable. Check whether the task is initiated and view the task status in the table. The status in the table may be inaccurate.obclient> SELECT * FROM __all_rootservice_job ORDER BY gmt_create desc limit 10;b. Check whether the task is being scheduled or in the queue.
SELECT * FROM __all_virtual_rebalance_task_stat;is_scheduled : yesindicates that the task is being scheduled. Another value indicates that the task is in the queue.c. Check the execution status of the load balancing task.
SELECT * FROM __all_rootservice_event_history WHERE value1 like "%table_id%partition_id%" ORDER BY gmt_create desc limit 10;The preceding statement identifies the specific load balancing task so that you can obtain the
table_id/partition_idvalue.In the following example, a
-4029error occurs due to the migration failure of a partition. Other error codes and messages may also appear in the error report.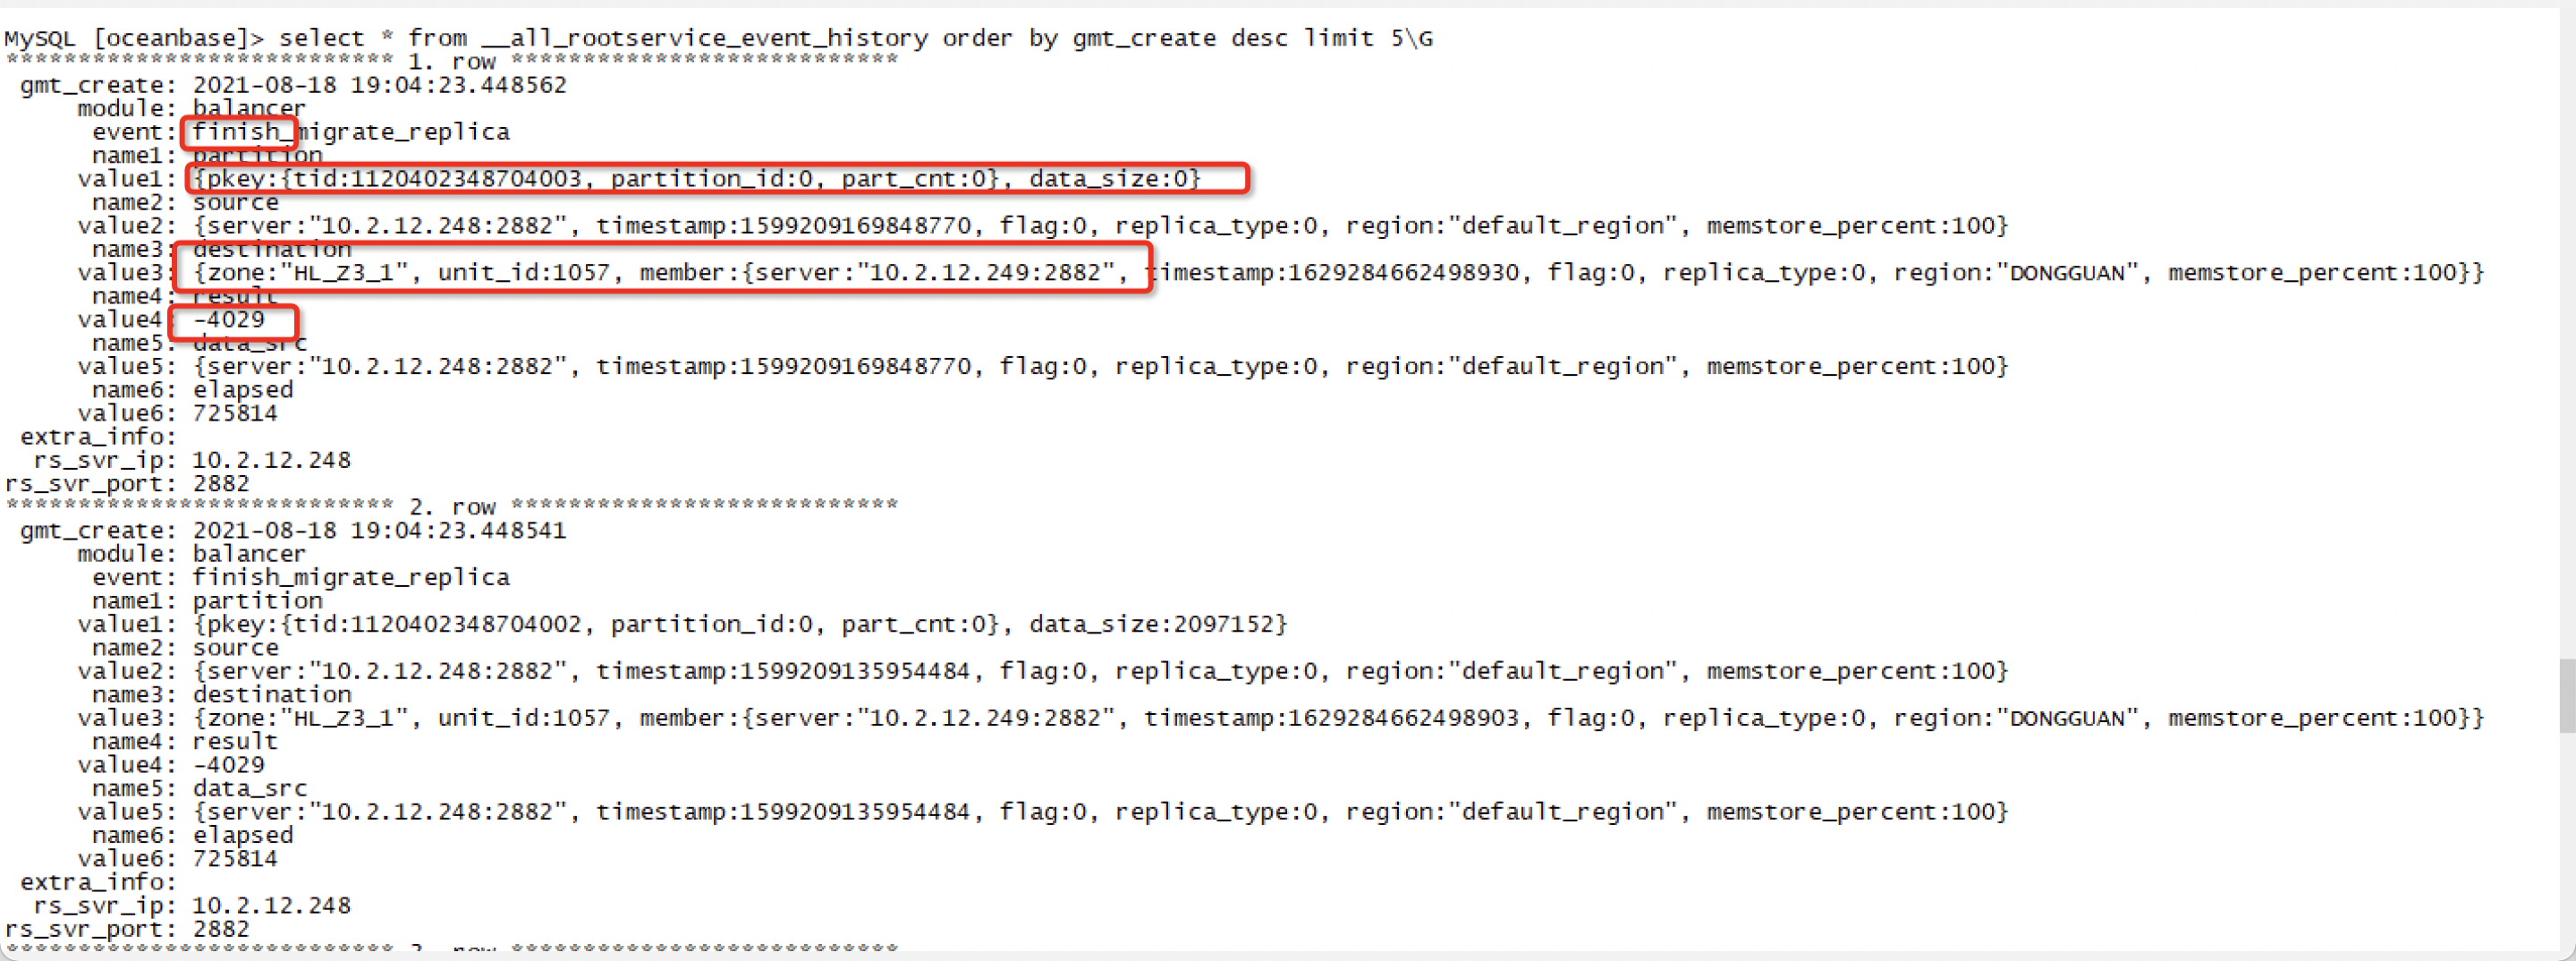
If the error report contains specific error messages, you can search for logs in the
observer.logorrootservice.logfile of thesourceanddestinationservers at the corresponding points in time bypkeyor error code, to obtain more detailed error information.Check the
__all_virtual_sys_task_statustable. This table is a virtual table of an OBServer node. It records the tasks that have been delivered to the OBServer node for execution.Check whether the scheduling status of the replica migration task at the storage layer meets the expectation.
SELECT * FROM __all_virtual_sys_task_status;
+----------------------------+---------------------------+-------------------------------+---------------+----------+-----------+---------------------------------------------------------------------------------------------------------------------------------------------------------------------------------------------------------------------------------------------+-----------+
| start_time                 | task_type                 | task_id                       | svr_ip        | svr_port | tenant_id | comment                                                                                                                                                                                                                                     | is_cancel |
+----------------------------+---------------------------+-------------------------------+---------------+----------+-----------+---------------------------------------------------------------------------------------------------------------------------------------------------------------------------------------------------------------------------------------------+-----------+
| 2019-03-01 00:01:01.710589 | group partition migration | YB420BE80B86-00057350CB72EC9F | xx.xxx.xxx.xx |     2882 |      1040 | group partition migration: group_task_id=YB420BE80B86-00057350CB72EC9F partition_count=1 partition_id=0 key={tid:1143492092937043, partition_id:0, part_cnt:0}, op_type=ADD_REPLICA_OP, src="xx.xxx.xx.xx:2882", dest="xx.xxx.xxx.xx:2882", |         0 |
| 2019-03-01 00:01:01.716896 | partition migration       | YB420BBEE129-000582EC67B0BBB5 | xx.xxx.xxx.xx |     2882 |      1040 | single partition migration: group_task_id=YB420BE80B86-00057350CB72EC9F key={tid:1143492092937043, partition_id:0, part_cnt:0}, op_type=ADD_REPLICA_OP, src="xx.xxx.xx.xx:2882", dest="xx.xxx.xxx.xx:2882",                                 |         0 |
+----------------------------+---------------------------+-------------------------------+---------------+----------+-----------+---------------------------------------------------------------------------------------------------------------------------------------------------------------------------------------------------------------------------------------------+-----------+
2 rows in set (0.06 sec)
Troubleshooting procedure
This section describes how to troubleshoot four types of replica migration issues: common issues, manual scheduling issues, slow migration, and migration failures.
Common causes
The most common issue of replica migration is that the replica migration task is blocked because the destination disk is full. In this case, you can take further actions based on the background logs and database status.
Check the server where the migration issue occurs.
SELECT * FROM __all_server WHERE block_migrate_in_time > 0 \GIf replica migration to a server is blocked because the disk is full, the
block_migrate_in_timevalue of the server is not 0, but is a timestamp. You can convert the timestamp into the corresponding point in time when migration is blocked. In addition, you can execute the following statement to unblock replica migration:ALTER system SET migration_disable_time = "600s";Query the disk usage.
SELECT a.zone, a.svr_ip,
       round(disk_in_use / 1024 / 1024 / 1024, 3) AS disk_used_G,
       round(disk_total / 1024 / 1024 / 1024, 3) AS disk_total_G,
       round(disk_in_use / disk_total, 4) * 100 AS disk_used_pct
FROM   oceanbase.__all_meta_table a,
       oceanbase.__all_virtual_server_stat b
WHERE a.svr_ip = b.svr_ip
GROUP BY a.zone, a.svr_ip
ORDER BY disk_used_pct desc , a.zone, a.svr_ip;

+---------------+----------------+-------------+--------------+---------------+
| zone          | svr_ip         | disk_used_G | disk_total_G | disk_used_pct |
+---------------+----------------+-------------+--------------+---------------+
| zone1         |  ip            |   15460.984 |    17305.309 |       89.3400 |
| zone2         |  ip            |   15355.619 |    17305.309 |       88.7300 |
| zone3         |  ip            |   11304.959 |    12760.816 |       88.5900 |
+---------------+----------------+-------------+--------------+---------------+
19 rows in set (0.04 sec)
Notice
In OceanBase Database V2.x and later versions, replace
__all_meta_tablewith__all_virtual_meta_table.
Manual scheduling issues
RootService of OceanBase Database schedules resource unit migration tasks. If a migration task is not scheduled for a long period, perform the following steps for troubleshooting:
Query the IP address of the server that runs RootService.
obclient> SELECT * FROM __all_server WHERE with_rootserver=1;
+----------------------------+----------------------------+----------------+----------+----+-------+------------+-----------------+--------+-----------------------+--------------------------------------------------------------------------------------+-----------+--------------------+--------------+----------------+-------------------+
| gmt_create                 | gmt_modified               | svr_ip         | svr_port | id | zone  | inner_port | with_rootserver | status | block_migrate_in_time | build_version
                                          | stop_time | start_service_time | first_sessid | with_partition | last_offline_time |
+----------------------------+----------------------------+----------------+----------+----+-------+------------+-----------------+--------+-----------------------+--------------------------------------------------------------------------------------+-----------+--------------------+--------------+----------------+-------------------+
| 2021-03-24 10:32:55.367438 | 2021-03-24 10:35:56.904319 |  10.0.0.0      |     2882 |  2 | zone2 |       2881 |               1 | active |                     0 | 2.2.76_20210314152507-03d916596ba416277bf49a1a2fccb0b0d36a1631(Mar 14 2021 15:56:27) |         0 |   1616553286007503 |            0 |              1 |                 0 |
+----------------------------+----------------------------+----------------+----------+----+-------+------------+-----------------+--------+-----------------------+--------------------------------------------------------------------------------------+-----------+--------------------+--------------+----------------+-------------------+
1 row in set (0.01 sec)
Log on to the server that runs RootService and run the following command to query balancer logs:
[admin@oceanbase /]$ grep balancer log/rootservice.log
Slow migration
Check the database configurations. Recommended configurations are as follows:
Set
server_data_copy_out_concurrencyto 10. This parameter specifies the maximum number of concurrent tasks allowed for migrating data out of a single server.Set
server_data_copy_in_concurrencyto 10. This parameter specifies the maximum number of concurrent tasks allowed for migrating data to a single server.Set
sys_bkgd_io_low_percentageas needed. This parameter specifies the lower limit ofsys_io_percent. If the value of this parameter is too small, compaction I/O operations may be slow. You can properly increase the value to improve the I/O performance.Set
sys_bkgd_net_percentageas needed. This parameter specifies the percentage of the network bandwidth that can be used by background system tasks.
For more information about the preceding parameter, see "System parameters" in OceanBase Database Reference Guide.
Check whether resource unit migration is performed in remote mode.
Run the following command to check the latency. If the latency is longer than 5 ms, resource unit migration is performed in remote mode.
[admin@oceanbase /]$ ping <observer_ip>We recommend that you set the
tcp_slow_start_after_idleparameter in thesysctl.conffile of the operating system to 0. This prevents idle Transmission Control Protocol (TCP) connections from being reset.observer_ipspecifies the IP address of the destination server.Checks whether I/O operations reach the disk bottleneck.
Command and sample result:
[root@hostname /]# iostat -x -k 1
Linux 3.10.0-327.ali2019.alios7.x86_64 (k08j13249.eu95sqa)      03/30/2021      _x86_64_        (64 CPU)

avg-cpu:  %user   %nice %system %iowait  %steal   %idle
          16.29    0.00    6.85    0.02    0.00   76.84
Check whether I/O throttling is enabled.
Run the following command to check whether the value of
io_pscorresponding to the value2097152in theio_size_bytecolumn exceeds 500:[admin@oceanbase /]$ cat etc/io_resource.conf version 1 io_type io_size_byte io_ps io_rt_us 0 4096 139979.75 123.25 0 8192 122290.50 139.44 0 16384 102972.00 164.16 0 32768 64478.75 196.28 0 65536 38162.25 219.13 0 131072 20608.50 232.28 0 262144 10537.00 280.90 0 524288 5284.00 414.86 1 2097152 890.00 1781.68 submit_thread_cnt 1 getevent_thread_cnt 5If the
io_psvalue is less than 500, check whether the value ofsys_io_high_percentis the same as that ofsys_bkgd_io_low_percentage. If not, I/O throttling is enabled. Command and sample result:[admin@oceanbase /]$ grep io_stat log/observer.log [2019-01-11 16:45:35.629871] INFO [COMMON] ob_io_manager.cpp:1424 [26043][Y0-0000000000000000] [lt=18] Current io stat, (sys_io_percent=60, sys_iops_up_limit=770, user_max_rt=20775.528088989257, user_io_stat={average_size:0, average_rt_us:"0.000000000000", old_stat:{io_cnt:27169649, io_bytes:349257160063, io_rt_us:276864943639}, new_stat:{io_cnt:27169649, io_bytes:349257160063, io_rt_us:276864943639}}, sys_io_stat={average_size:2097152, average_rt_us:"2784.086956521739", old_stat:{io_cnt:10151653, io_bytes:21289559392256, io_rt_us:127287447387}, new_stat:{io_cnt:10151676, io_bytes:21289607626752, io_rt_us:127287511421}}, io_conf={sys_io_low_percent:50, sys_io_high_percent:60, user_iort_up_percent:100, cpu_high_water_level:7680, write_failure_detect_interval:60000000, read_failure_black_list_interval:300000000, retry_warn_limit:2, retry_error_limit:5}, cpu_stat={avg_usage:584})Check network configurations.
a. Check whether the NIC is a GE or 10GE NIC.
b. Check whether the output of the
ifconfigcommand containsdroporerrorpackets.c. Run the
tsarorvsarcommand to check the retrans value. If the retrans value is greater than 0.2, the switch or the link is abnormal.Check the step where slow migration occurs.
Execute the following statement to check the value of the
ACTIONfield. This field indicates the migration status.obclient> SELECT * FROM __all_virtual_partition_migration_status WHERE action!='END' AND result = 0\G
Migration failures
Check the returned error code.
Common errors corresponding to migration failures:
ERROR 4109: This error is common in OceanBase Database V1.4. It occurs if the destination server is in the process of a major or minor compaction. If this error occurs during a rebuild, you can speed up the major compaction to remove the error. For example, you can increase the number of major compaction threads or the maximum bandwidth of
sysio.ERROR 4018: This error indicates that the required data is not found due to a major or minor compaction on the source server. In case of this error, you can increase the migration bandwidth or the maximum bandwidth of
sysio, or reduce the frequency of major and minor compactions.
Check the hardware.
a. Check whether the hardware of the server is faulty.
b. Check error logs.
If an empty result is returned for the following command, no fault has occurred.
[root@hostname /]# dmesg|grep -E "Failed status, reset controller|Controller encountered a fatal error and was reset|Controller encountered a fatal error and was resetIf a server is configured with
raid, run the following command to check the raid configurations. If an empty result is returned, no fault has occurred.[root@hostname /]# tbraid log | grep -E "Read Medium ERR|Error"c. Run the following command to check for RX or TX errors:
[root@hostname /]# ifconfig
bond0: flags=5187<UP,BROADCAST,RUNNING,MASTER,MULTICAST>  mtu 1500
        inet xxx.xxx.xxx.xxx  netmask 255.255.255.0  broadcast xxx.xxx.xxx.xxx
        ether xx:xx:xx:xx:xx:xx  txqueuelen 0  (Ethernet)
        RX packets 234167440  bytes 206275603707 (192.1 GiB)
        RX errors 0  dropped 63  overruns 0  frame 0
        TX packets 241808476  bytes 97456446934 (90.7 GiB)
        TX errors 0  dropped 0 overruns 0  carrier 0  collisions 0
d. Run the
tsarorvsarcommand to check theretransvalue. If the retrans value is greater than 0.2, the network link is abnormal.[root@hostname /]# tsar Time ---cpu-- ---mem-- ---tcp-- -----traffic---- --sda--- --dfa--- --dfb--- --dfc--- --dm-0-- --dm-7-- --dm-8-- --dm-9-- -dm-10-- -dm-11-- -dm-12-- -dm-14-- -dm-24-- --dm-3-- --dm-2-- --dm-4-- -dm-15-- --dm-5-- -dm-16-- -dm-18-- -dm-17-- -dm-21-- -dm-19-- -dm-20-- --dm-1-- --dm-6-- -dm-13-- -dm-22-- -dm-23-- -dm-25-- -dm-28-- -dm-26-- -dm-27-- -dm-29-- -dm-30-- -dm-31-- ---load- Time util util retran bytin bytout util util util util util util util util util util util util util util util util util util util util util util util util util util util util util util util util util util util util load1 30/03/21-16:45 21.62 53.82 0.00 3.0K 4.9K 0.01 0.04 0.33 1.26 0.00 0.00 0.00 0.00 0.00 0.00 0.01 0.00 0.00 0.40 0.00 0.00 0.39 0.00 0.01 0.29 0.00 0.00 0.00 0.00 0.02 0.35 0.39 0.00 0.00 0.15 0.00 0.00 0.00 0.00 0.00 0.00 15.31 30/03/21-16:50 21.59 54.39 0.00 2.9K 4.8K 0.01 0.04 0.30 1.20 0.00 0.00 0.00 0.00 0.00 0.00 0.01 0.00 0.00 0.37 0.01 0.00 0.37 0.00 0.01 0.29 0.00 0.00 0.00 0.00 0.02 0.32 0.39 0.00 0.00 0.14 0.00 0.00 0.00 0.00 0.00 0.00 12.37 30/03/21-16:55 24.40 54.68 0.00 2.9K 4.9K 0.01 0.27 1.08 32.99 0.00 0.00 0.00 0.00 0.00 0.00 0.02 0.00 0.00 0.40 0.00 0.01 0.40 0.00 0.01 0.28 0.00 0.00 0.00 0.00 0.24 1.10 32.64 0.00 0.00 0.16 0.00 0.00 0.00 0.00 0.00 0.00 24.60 30/03/21-17:00 24.46 55.30 0.00 2.9K 4.9K 0.01 0.19 1.11 18.98 0.00 0.00 0.00 0.00 0.00 0.00 0.01 0.00 0.00 0.38 0.00 0.00 0.37 0.00 0.01 0.28 0.00 0.00 0.00 0.00 0.17 1.13 18.49 0.00 0.00 0.17 0.00 0.00 0.00 0.00 0.00 0.00 19.38 30/03/21-17:05 21.74 55.89 0.00 2.9K 4.9K 0.01 0.04 0.02 1.26 0.00 0.00 0.00 0.00 0.00 0.00 0.01 0.00 0.00 0.41 0.01 0.00 0.36 0.00 0.01 0.30 0.00 0.00 0.00 0.00 0.02 0.03 0.38 0.00 0.00 0.16 0.00 0.00 0.00 0.00 0.00 0.00 16.01 MAX 38.78 79.44 0.13 1.7M 51.1K 0.69 1.55 55.95 50.54 0.00 0.00 0.00 0.00 0.00 0.00 0.61 0.12 0.00 6.98 0.01 0.11 6.65 0.12 0.01 4.94 0.00 6.50 0.34 55.83 0.33 12.47 45.96 0.82 55.79 6.68 6.63 0.34 55.81 1.14 0.00 0.00 61.70 MEAN 29.42 76.67 0.00 9.4K 5.2K 0.01 0.09 0.71 3.73 0.00 0.00 0.00 0.00 0.00 0.00 0.01 0.00 0.00 0.44 0.01 0.01 0.44 0.00 0.01 0.33 0.00 0.40 0.01 0.35 0.03 0.20 2.13 0.02 0.55 0.43 0.41 0.01 0.35 0.00 0.00 0.00 22.73 MIN 16.84 48.16 0.00 2.8K 4.2K 0.01 0.06 0.00 1.14 0.00 0.00 0.00 0.00 0.00 0.00 0.01 0.00 0.00 0.42 0.01 0.01 0.41 0.00 0.01 0.29 0.00 0.04 0.01 0.00 0.02 0.00 0.34 0.01 0.00 0.04 0.04 0.01 0.00 0.00 0.00 0.00 10.32 [root@hostname /]# vsar Time ---cpu-- ---mem-- ---tcp-- -----traffic---- --sda--- --dfa--- --dfb--- --dfc--- --dm-0-- --dm-7-- --dm-8-- --dm-9-- -dm-10-- -dm-11-- -dm-12-- -dm-14-- -dm-24-- --dm-3-- --dm-2-- --dm-4-- -dm-15-- --dm-5-- -dm-16-- -dm-18-- -dm-17-- -dm-21-- -dm-19-- -dm-20-- --dm-1-- --dm-6-- -dm-13-- -dm-22-- -dm-23-- -dm-25-- -dm-28-- -dm-26-- -dm-27-- -dm-29-- -dm-30-- -dm-31-- ---load- Time util util retran bytin bytout util util util util util util util util util util util util util util util util util util util util util util util util util util util util util util util util util util util util load1 30/03/21-17:09:13 21.32 56.40 0.00 949.00 5.4K 0.02 0.06 0.00 1.38 0.00 0.00 0.00 0.00 0.00 0.00 0.00 0.00 0.00 0.34 0.02 0.00 0.32 0.00 0.00 0.36 0.00 0.00 0.00 0.00 0.02 0.00 0.42 0.02 0.00 0.24 0.00 0.00 0.00 0.00 0.00 0.00 13.32 30/03/21-17:09:18 21.46 56.41 0.00 4.4K 33.3K 1.42 0.00 0.00 0.92 0.00 0.00 0.00 0.00 0.00 0.00 0.00 0.00 0.00 0.28 0.00 0.00 0.38 0.00 0.00 0.30 0.00 0.00 0.00 0.00 0.00 0.00 0.26 0.00 0.00 0.14 0.00 0.00 0.00 0.00 0.00 0.00 12.74 30/03/21-17:09:23 21.73 56.41 0.00 931.00 5.3K 0.00 0.04 0.00 1.12 0.00 0.00 0.00 0.00 0.00 0.00 0.02 0.00 0.00 0.26 0.00 0.02 0.40 0.00 0.00 0.40 0.00 0.00 0.00 0.00 0.00 0.00 0.28 0.00 0.00 0.20 0.00 0.00 0.00 0.00 0.00 0.00 12.68 30/03/21-17:09:28 22.16 56.44 0.00 10.8K 5.1K 0.02 0.02 0.00 1.92 0.00 0.00 0.00 0.00 0.00 0.00 0.02 0.00 0.00 0.40 0.00 0.00 0.60 0.00 0.00 0.26 0.00 0.00 0.00 0.00 0.00 0.00 0.90 0.00 0.00 0.24 0.00 0.00 0.00 0.00 0.00 0.00 13.02 30/03/21-17:09:33 21.07 56.44 0.00 863.00 5.3K 0.00 0.02 0.00 1.16 0.00 0.00 0.00 0.00 0.00 0.00 0.00 0.00 0.00 0.34 0.00 0.00 0.36 0.00 0.02 0.38 0.00 0.00 0.00 0.00 0.00 0.00 0.28 0.00 0.00 0.28 0.00 0.00 0.00 0.00 0.00 0.00 13.02 30/03/21-17:09:38 21.21 56.45 0.00 2.3K 4.4K 0.02 0.08 0.00 1.02 0.00 0.00 0.00 0.00 0.00 0.00 0.00 0.00 0.00 0.36 0.00 0.02 0.38 0.00 0.00 0.16 0.00 0.00 0.00 0.00 0.06 0.00 0.26 0.00 0.00 0.16 0.00 0.00 0.00 0.00 0.00 0.00 13.02 30/03/21-17:09:43 21.18 56.44 0.00 2.8K 5.2K 0.00 0.06 0.00 1.08 0.00 0.00 0.00 0.00 0.00 0.00 0.00 0.00 0.00 0.34 0.02 0.02 0.26 0.00 0.00 0.18 0.00 0.00 0.00 0.00 0.00 0.00 0.30 0.00 0.00 0.16 0.00 0.02 0.00 0.00 0.00 0.00 13.34 30/03/21-17:09:48 20.99 56.44 0.00 2.3K 4.3K 0.00 0.02 0.00 0.98 0.00 0.00 0.00 0.00 0.00 0.00 0.00 0.00 0.00 0.22 0.00 0.00 0.32 0.00 0.00 0.34 0.00 0.00 0.00 0.00 0.00 0.00 0.20 0.02 0.00 0.10 0.00 0.00 0.00 0.00 0.00 0.00 13.07 30/03/21-17:09:53 21.52 56.45 0.00 863.00 5.1K 0.02 0.02 0.00 0.96 0.00 0.00 0.00 0.00 0.00 0.00 0.02 0.00 0.00 0.30 0.00 0.00 0.30 0.00 0.00 0.20 0.00 0.00 0.00 0.00 0.00 0.00 0.26 0.00 0.00 0.20 0.00 0.00 0.00 0.00 0.00 0.00 13.39 30/03/21-17:09:58 21.44 56.47 0.00 8.0K 4.5K 0.00 0.00 0.00 1.18 0.00 0.00 0.00 0.00 0.00 0.00 0.00 0.00 0.00 0.38 0.00 0.00 0.34 0.00 0.00 0.24 0.00 0.00 0.00 0.00 0.00 0.00 0.36 0.00 0.00 0.18 0.00 0.00 0.00 0.00 0.00 0.00 12.80 30/03/21-17:10:03 24.46 56.48 0.00 1.1K 5.5K 0.00 0.02 0.00 1.26 0.00 0.00 0.00 0.00 0.00 0.00 0.00 0.00 0.00 0.30 0.00 0.00 0.34 0.00 0.02 0.28 0.00 0.00 0.00 0.00 0.00 0.00 0.50 0.00 0.00 0.18 0.00 0.00 0.00 0.00 0.00 0.00 13.02 MAX 74.03 56.45 0.00 15.4M 186.1K 30.10 17.46 100.00 92.10 0.00 0.00 0.00 0.00 0.00 0.26 12.90 0.00 0.00 1.06 1.24 1.00 0.90 0.00 1.02 0.92 0.00 43.00 4.68 100.00 3.18 97.52 92.64 4.30 100.00 74.30 42.90 3.80 100.00 0.00 0.00 0.00 50.61 MEAN 22.13 51.58 0.00 78.8K 7.5K 0.05 0.18 7.02 4.33 0.00 0.00 0.00 0.00 0.00 0.00 0.05 0.00 0.00 0.39 0.01 0.01 0.38 0.00 0.01 0.29 0.00 0.15 0.02 4.19 0.04 0.88 3.36 0.04 6.54 0.36 0.15 0.02 4.20 0.00 0.00 0.00 15.21 MIN 16.19 48.24 0.00 642.00 3.9K 0.01 0.02 0.00 0.64 0.00 0.00 0.00 0.00 0.00 0.00 0.00 0.00 0.00 0.18 0.01 0.00 0.14 0.00 0.00 0.08 0.00 0.00 0.00 0.00 0.01 0.01 0.08 0.00 0.00 0.00 0.00 0.00 0.00 0.00 0.00 0.00 9.37Check for kernel errors.
Run the following command to check whether a kernel error has occurred:
[root@hostname /]# dmesg |grep blockedIf a log like
task xxx blocked for more than 120 secondsis generated, the kernel does not function properly. In this case, you can upgrade the kernel.