


The SQL monitoring services on OceanBase Cloud Platform (OCP) consist of TopSQL and SlowSQL. The services are available to database administrators (DBAs) and common users. They can use the services to locate cluster performance exceptions and common SQL execution exceptions, so as to rectify cluster performance exceptions and improve SQL execution efficiency.
Background
The differences between TopSQL and SlowSQL are as follows:
TopSQL sorts and displays SQL statements with different content by execution efficiency.
SlowSQL sorts displays all the slow SQL statements by execution efficiency. Slow SQL statements are statements whose execution time exceeds the slow query threshold. You can specify the SQL content to locate a specific SQL statement and analyze the performance changes of the SQL statement in different time periods.
The uses of TopSQL and SlowSQL are as follows:
TopSQL query results usually reflect the performance differences of SQL statements of different types executed by an OceanBase cluster, a tenant, or a server in a specific time period. You can use the TopSQL feature to identify SQL statements with poor execution performance in a database.
SlowSQL query results usually reflect the performance changes of an SQL statement in different time periods. You can use the SlowSQL feature to locate the causes of the SQL performance changes.
Note
The operation interface of OCP may vary with the version. The following describes how to use TopSQL and SlowSQL to facilitate troubleshooting on OCP V2.4.4. For operations on OCP of other versions, see the OCP User Guide of the corresponding version.
TopSQL
You can filter abnormal SQL statements and identify the causes of SQL execution exceptions by analyzing the historical SQL trends and physical execution plans.
Log on to the OCP console.
In the upper-right corner, click Return to Old Version .
In the left-side navigation pane, choose Monitoring > TopSQL to go to the TopSQL monitoring page.
On the top of the page, specify the target cluster, zone, OBServer, tenant, and time range.
We recommend that you set the time range within one day. Otherwise, the query may time out.

After the set of SQL statements meeting the specified search criteria is returned, select the performance metric to be displayed in the Extended Column list and select the SQL type in the SQL Type list.

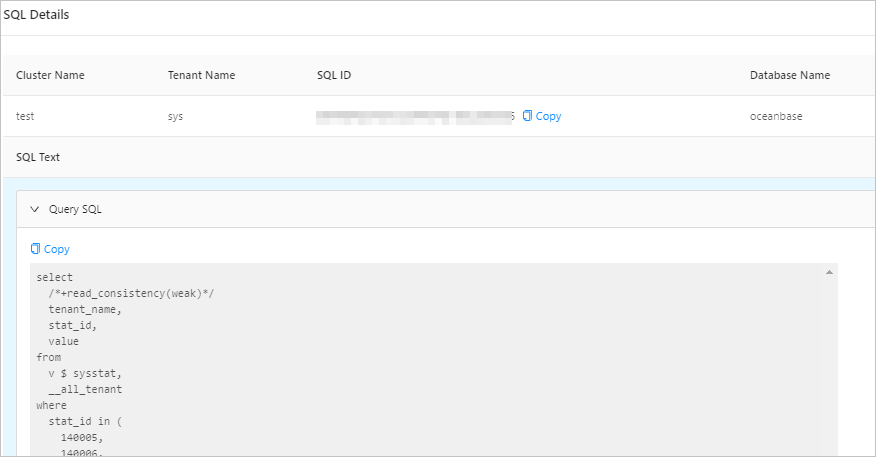
You can pinpoint the corresponding SQL statement based on the Response time and Time Consumed for the Slowest Execution metrics. Click the sequence number of the SQL statement to go to the SQL Details page. View the content of the SQL statement and Historical Trends of SQL Statements .
In SQL Diagnosis area, click the Physical Execution Plan tab and identify the cause for the SQL statement execution exception.
SlowSQL
Slow SQL statements greatly affect database stability. From the perspective of a database, the execution of each SQL statement consumes some I/O resources. The execution speed of an SQL statement determines the length of time when the resources are occupied. Assume that the total resources are 100%, and one slow SQL statement occupies 30% of resources for one minute. During this period, the total amount of resources that other SQL statements can consume is 70%. By analogy, when all resources are occupied, all new SQL statements will be queued, affecting the throughput of the database system. From the perspective of online transactional processing (OLTP) applications, a longer execution time of an SQL statement means a longer wait time, resulting in poor user experience. Therefore, when a database has problems such as high load and performance jitter, DBAs or development personnel will first check whether slow SQL statements are being executed.
Log on to the OCP console.
In the upper-right corner, click Return to Old Version .
In the left-side navigation pane, choose Monitoring > SlowSQL to go to the SlowSQL monitoring page.
On the top of the page, specify the cluster, zone, OBServer, tenant, username, SQL_ID, Query SQL, and time range, and click Search to obtain the SQL statistics meeting the specified search criteria. Usually, SQL statements with the same execution plan have the same SQL_ID.
Notice
The metrics displayed on this page are fixed and cannot be customized.

Click View to go to the details page of a specific SQL statement. The
elapsed_timemetric indicates the time consumed in microseconds.