


You can view the historical performance monitoring information of clusters on OCP.
Background
The operation interface of OCP may vary with the version. The following describes how to view performance monitoring information on OCP V2.4.4. For operations on other OCP versions, see the OCP User Guide of the corresponding version.
Performance monitoring information of all clusters
Log on to the OCP console. On the Cluster Overview page, you can specify a performance metric to view top 5 clusters sorted by the specified metric. You can view top 5 clusters sorted by a specified performance metric in descending order in a specified time range.

To view information about top 5 clusters by performance metric, specify the performance metric and the time range based on the business needs.
The following performance metrics are available:
QPS(times/s)
Query response time (us)
Number of active sessions
CPU Usage (percent)
The following time ranges are available:
Last 1 Hour
Last 24 Hours
Last 7 Days
Performance monitoring information of all tenants
Log on to the OCP console.
The Cluster Overview page automatically appears.
In the left-side navigation pane, click Tenant Management .
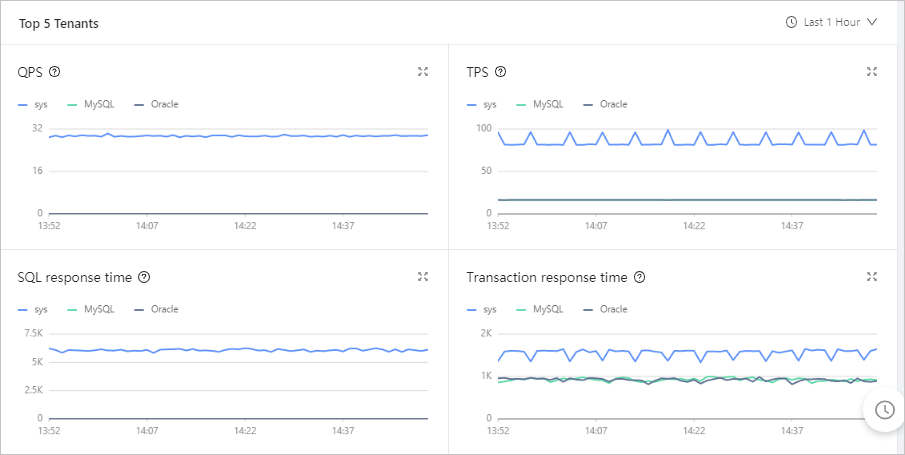
In the Top 5 Tenants area on the Tenant Overview page, you can view top 5 tenants sorted by performance metrics such as TPS, QPS, SQL response time, transaction response time, number of active sessions, event waiting_number of times, event waiting_time, capacity_number of tables, and capacity_number of partitions.
You can view the monitoring information of the last 1 hour, the last 24 hours, or the last 7 days.

The performance monitoring metrics are listed in the following table.
MetricDescriptionData sourceQPS The average number of SQL queries executed per second (queries/second). v$sysstat TPS The average number of transactions processed per second (transactions/second) v$sysstat SQL response time The SQL response time (us). v$sysstat Transaction response time The average time taken by the server to process a transaction (us). v$sysstat Number of active sessions The number of active sessions (sessions) in this tenant. __all_virtual_processlist Event waiting_number of times The average number of wait events per second (events/second). v$system_event Event waiting_time The average wait time of each wait event (us). v$system_event Capacity_Number of tables The number of tables. gv$table Capacity_Number of Partitions The number of partitions. v$partition
Performance monitoring information of a specific cluster
Log on to the OCP console.
The Cluster Overview page automatically appears.
In the Clusters area on the Cluster Overview page, select the target cluster and click its name.
In the left-side navigation pane on the page that appears, click Performance Monitoring .
In the Data Filtering area, you can specify the following parameters to filter performance information:
Select Time : Specify a time range to view the performance information within this period.
Stat Period :
Specify the length of the statistical period of a performance data point. The value can be Per Minute or Per Second , indicating that the performance statistics are in the one-minute or one-second granule.
OCP also calculates a statistical period of a data point based on the specified time range following the principle that approximately 1440 data points will be returned in total. If you specify a long time range, the actual statistical period may be longer than 1 minute.
Zone : Select zones to view their performance monitoring data.
OBServer : Select OBServers to view their performance monitoring data.
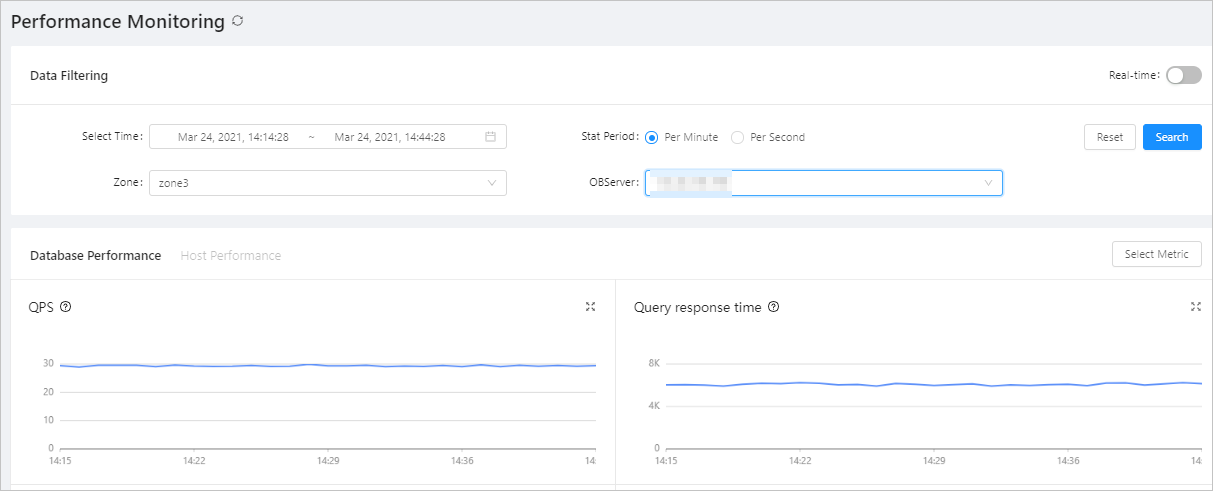
To view the real-time performance data, turn on the Real-time switch in the upper-right corner and specify the refresh frequency, Zone, and OBServer. The system refreshes the performance data at the specified refresh frequency. By default, per-second performance data of the last two minutes is displayed. The refresh frequency can be 10 seconds or 1 second.
Switch between tabs to view the performance of databases and hosts in the cluster.
To view other metrics, click Select Metric in the upper-right corner of the area and select the desired metrics on the Select Metric page. The system can display performance data by up to 10 metrics.
For more information about database performance metrics and host performance metrics, see Monitoring metrics in the OCP User Guide of the corresponding version.
Tenant performance monitoring information of a specific cluster
You can view the performance information of the five tenants with the highest workloads in a cluster.
Log on to the OCP console.
The Cluster Overview page automatically appears.
In the Clusters area on the Cluster Overview page, select the target cluster and click its name.
In the left-side navigation pane on the page that appears, click Tenant Management .
In the Top 5 Tenants area on the Tenant Management page, you can view the top 5 tenants sorted by performance metrics such as TPS, QPS, SQL response time, transaction response time, number of active sessions, event waiting_number of times, event waiting_time, capacity_number of tables, and capacity_number of partitions.
You can view the monitoring information of the last 1 hour, the last 24 hours, or the last 7 days.
Performance monitoring information of a specific tenant
Log on to the OCP console.
The Cluster Overview page automatically appears.
In the left-side navigation pane, click Tenant Management .
In the Tenants list, click the name of the target tenant to go to the Overview page.
In the left-side navigation pane, click Performance Monitoring .
You can specify the following parameters to filter performance information:
Select Time :
Specify a time range to view the performance information within this period.
Stat Period :
Specify the length of the statistical period of a performance data point. The value can be Per Minute or Per Second, indicating that the performance statistics are in the one-minute or one-second granule.
OCP also calculates a statistical period of a data point based on the specified time range following the principle that approximately 1440 data points will be returned in total. If you specify a long time range, the actual statistical period may be longer than 1 minute.
Zone : Select zones to view their performance monitoring data.
OBServer : Select OBServers to view their performance monitoring data.
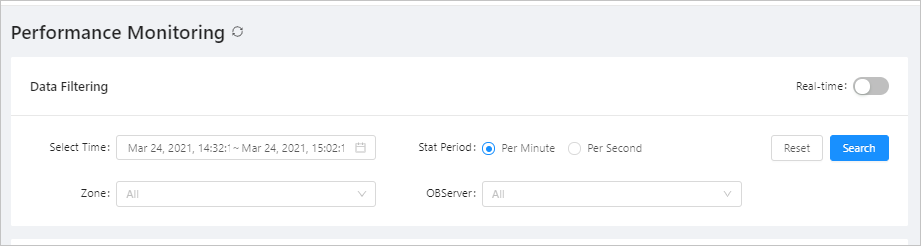
To view the real-time performance data of a tenant, turn on the Real-time switch in the upper-right corner. The system refreshes the performance data at the specified refresh frequency. By default, per-second performance data of the last two minutes is displayed. The refresh frequency can be 10 seconds or 1 second.

On the Throughput and SQL tab, view the monitoring data of the following metrics the tenant:
QPS: The average number of SQL statements processed per second.
Response time: The response time in the unit of μs.
Number of active sessions: The number of active sessions.
SQL execution plan category: The category of the SQL execution plan.
Wait Event: The average number of wait events per second.
Waiting for event time: The average wait time of a wait event in the unit of μs.
Request waiting queue: The number of SQL statements entering the request queue per second.
Request waiting queue time-consuming: The wait time of an SQL request in a queue in the unit of μs.

On the Transaction tab, view the monitoring data of the following metrics of the tenant:
TPS: The average number of transactions processed per second.
Transaction response time: The average processing time of each transaction on the server in the unit of μs.
Number of transaction logs: The number of transaction logs submitted per second.
Transaction log volume: The data volume of the transaction logs submitted per second in the unit of byte.
Transaction log time-consuming: The average time consumed for processing a transaction log on the server in the unit of μs.
Lock wait: The number of transaction lock waits per second.
Wait for lock time: The average wait time for a lock in the unit of μs.

On the Storage and Cache tab, view the monitoring data of the following metrics of the tenant:
MEMStore: The writable memory of the OceanBase database in the unit of MB.
IOPS: The average number of I/O requests processed per second.
I/O Time: The average time consumed for processing an I/O request in the unit of μs
IO throughput rate: The average volume of I/O data processed per second in the unit of byte.
Cache size: The size of the cache in the unit of MB.
Cache hit rate: The cache hit rate in the unit of %.
