


OBProxy can forward user-initiated data access requests to the corresponding OBServer. OBProxy allows you to create an OBProxy cluster, view the OBProxy cluster information, and view the OBProxy monitoring information.
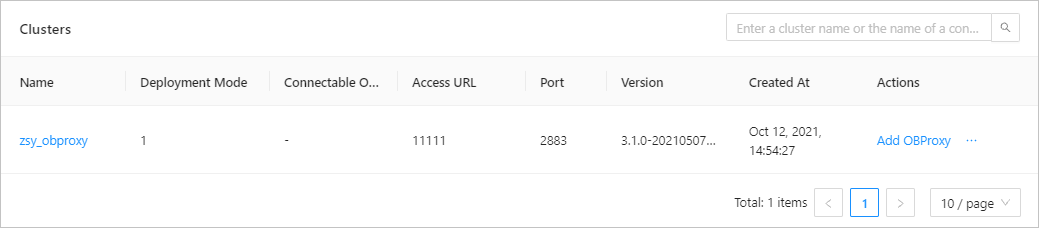
Clusters
The Clusters list contains the following columns: OBProxy Cluster Name, Deployment Mode, Accessible OceanBase Cluster, Access IP Address, Access Port, Version, Created At , and Actions . The Actions column provides the Add OBProxy and Delete options. Click a cluster name in the OBProxy Cluster Name or Accessible OceanBase Cluster column. The details page of the corresponding cluster appears. For more information, see Create an OBProxy cluster, Add an OBProxy, Delete an OBProxy cluster.
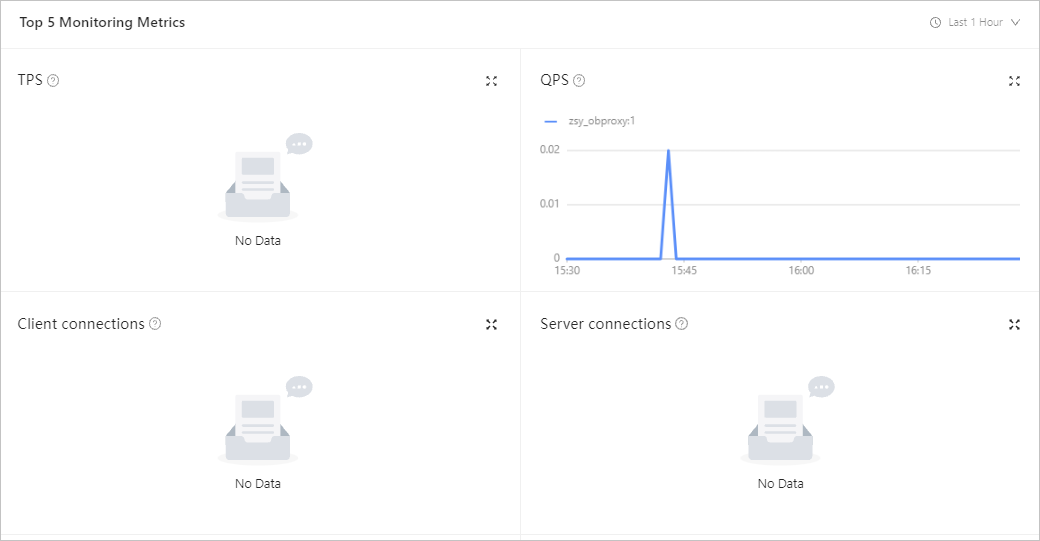
OBProxy Monitoring Top 5
In the OBProxy Monitoring Top 5 section, you can view statistics such as TPS, QPS, Client Connections, Server Connections, SQL Response Time, Error Packets, Routing Tables , and Bytes . You can click Last Hour, Last 24 Hours , and Last 7 Days in the drop-down list to view data of the corresponding time range.
Parameter |
Description |
|---|---|
| TPS | The number of transactions processed per second. |
| QPS | Queries per second. |
| Client Connections | The number of client connections. |
| Server Connections | The number of server connections. |
| SQL Response Time | The time spent on processing an SQL statement. |
| Error Package | The number of error response packages per second. |
| Routing Table | Information about routing tables. |
| Bytes | The data volume of network requests in the unit of bytes. |