This topic describes the tenant performance monitoring feature of OceanBase Cloud Platform (OCP).
Prerequisite
You have created a new tenant. For more information, see Create a tenant.
Procedure
Log on to the OCP console.
Select Tenants to go to the Tenants page.
In the Tenants list, find the target tenant and click its name.
In the left-side navigation pane on the page that appears, click Performance Monitoring .
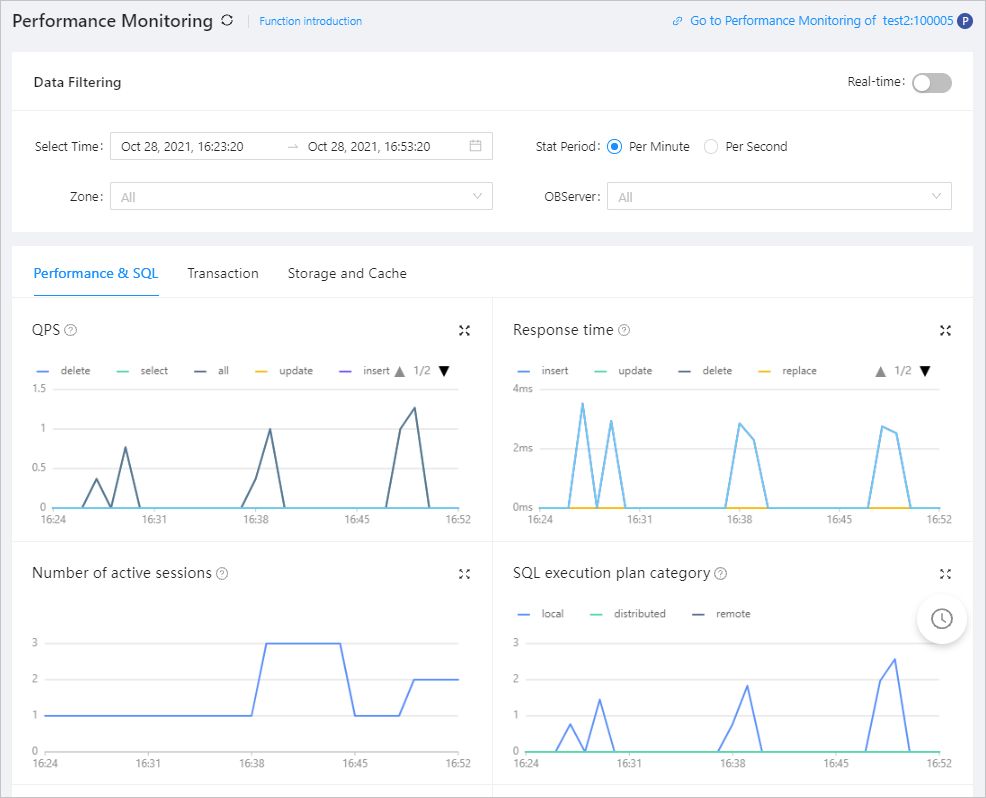
In the Data Filtering section, you can view the performance data by performing the following steps:
The following table describes the filter conditions.
ConditionDescriptionSelect Time (not displayed in real-time mode) Select a time range for the data that you want to query. Stat Period (not displayed in real-time mode) Specify the length of the statistical period of a performance data point. The value can be Per Minute or Per Second , indicating that the performance statistics are in the one-minute or one-second granule. OCP also calculates a statistical period of a data point based on the specified time range following the principle that approximately 1440 data points will be returned in total. If you specify a long time range, the actual statistical period may be longer than 1 minute. Zone Select the zone that you want to view. OBServer Select the OBServer that you want to view. After you specify the filter conditions, the system displays the performance monitoring data based on the selected period and statistical period.

Note
To view the trend details over a specific period, drag the pointer over the period to select this period. The system will then zoom in to display the trend details. After you view the trend details, double-click the trend chart to return to normal.
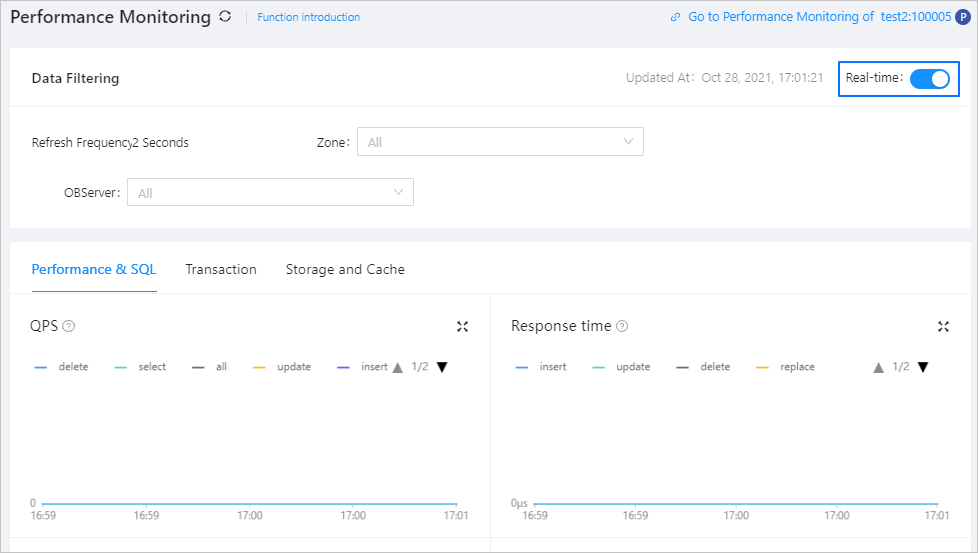
To view the performance data of an OBServer in real time, toggle on the Real-time switch in the upper-right corner and select the target OBServer.

Click the Performance & SQL , Transaction , Storage and Cache tabs to view different performance monitoring data.
For the specific meanings and value sources of all the metrics, see Monitoring metrics.
Click the Performance & SQL tab to view the SQL execution performance. The following table describes monitoring metrics related to performance and SQL execution.
MetricDescriptionQPS The average number of SQL statements processed per second. - all: The number of SQL statements processed per second.
- select: The number of SELECT statements processed per second.
- insert: The number of INSERT statements processed per second.
- update: The number of UPDATE statements processed per second.
- replace: The number of REPLACE statements processed per second.
- delete: The number of DELETE statements processed per second.
Response time Response time - all: The average time taken by the server to process an SQL statement, in the unit of µs.
- select: The average time taken by the server to process a SELECT statement, in the unit of µs.
- insert: The average time taken by the server to process an INSERT statement, in the unit of µs.
- update: The average time taken by the server to process an UPDATE statement, in the unit of µs.
- replace: The average time taken by the server to process a REPLACE statement, in the unit of µs.
- delete: The average time taken by the server to process a DELETE statement, in the unit of µs.
Active sessions The number of active sessions. SQL execution plan category SQL execution plan category - local: The number of local execution plans processed per second.
- remote: The number of remote execution plans processed per second.
- distributed: The number of distributed execution plans processed per second.
Event waiting_number of times The number of wait events per second. Event waiting_time The average wait time of a wait event, in the unit of µs. Request waiting queue The number of SQL queries entering the waiting queue per second. Time waiting in request queue The wait time of an SQL query in a queue. The CPU utilization. The CPU utilization in percentage. MEMStore usage The MEMStore usage in percentage. RPC packet response time The time consumed for receiving and sending RPC packets. - in: The average time consumed for receiving an RPC packet, in the unit of µs.
- out: The average time consumed for sending an RPC packet, in the unit of µs.
RPC package throughput The data amount of RPC packets that are sent and received per unit time - in: The throughput of receiving RPC packets, in the unit of bytes.
- out: The throughput of sending RPC packets, in the unit of bytes.
Click the Transaction tab to view the transaction performance. The following table describes transaction-related metrics.
MetricDescriptionTPS The average number of transactions processed per second. Transaction response time The average time taken by the server to process a transaction, in the unit of µs. Number of transaction logs The number of transaction logs committed per second. Transaction log volume The total size of transaction logs committed per second. Transaction log time consumption The average time taken by the server to process a transaction log, in the unit of µs. Lock wait The number of transaction lock waits per second. Wait for lock time The average wait time for a lock, in the unit of µs. Click the Storage and Cache tab to view the performance metrics related to storage and cache. The following table describes metrics related to storage and cache.
MetricDescriptionMEMStore The writable memory of the current tenant. - total: The total size of memory occupied by MEMStores, in the unit of MB.
- active: The size of memory occupied by active MEMStores (MB).
- trigger: The threshold of memory occupied by MEMStores to trigger a major compaction, in the unit of MB.
- limit: The maximum size of memory available for MEMStores, in the unit of MB.
IOPS The average number of I/O requests processed per second. - read: The number of reads from the SSStore per second.
- write: The number of writes to the SSStore per second.
I/O time The average time consumed for processing an I/O request. - read: The average time of a read from the SSStore, in the unit of μs.
- write: The average time of a write to the SSStore, in the unit of μs.
I/O throughput rate The average volume of I/O data processed per second. - read: The volume of data read from the SSStore per second, in the unit of bytes.
- write: The volume of data written to the SSStore per second, in the unit of bytes.
Cache size Cache size. - block_cache: The size of the block cache, in the unit of MB.
- row_cache: The size of the row cache, in the unit of MB.
- plan_cache: The size of the execution plan cache, in the unit of MB.
Cache retrieval rate Cache retrieval rate. - block_cache: The hit rate of the block cache in the unit of %.
- row_cache: The hit rate of the row cache in the unit of %.
- plan_cache: The hit rate of the execution plan cache in the unit of %.

