The cluster performance monitoring feature of OBProxy supports service monitoring and system monitoring.
Service monitoring
On the Service Monitoring tab, you can set the unit of the statistical period to Minute or Second . You can also select Last 30 Minutes, Last 1 Hour , or Custom Time for Duration .

You can turn on Real-time to view data updated in real time. You can select a Refresh Frequency of 10 Seconds or 1 Second .

In the Overview section, click View All in the upper-right corner to view the transaction count per second, requests, connected clients, connected servers, SQL processing time, error response packets per second, routing table, and network request bytes.

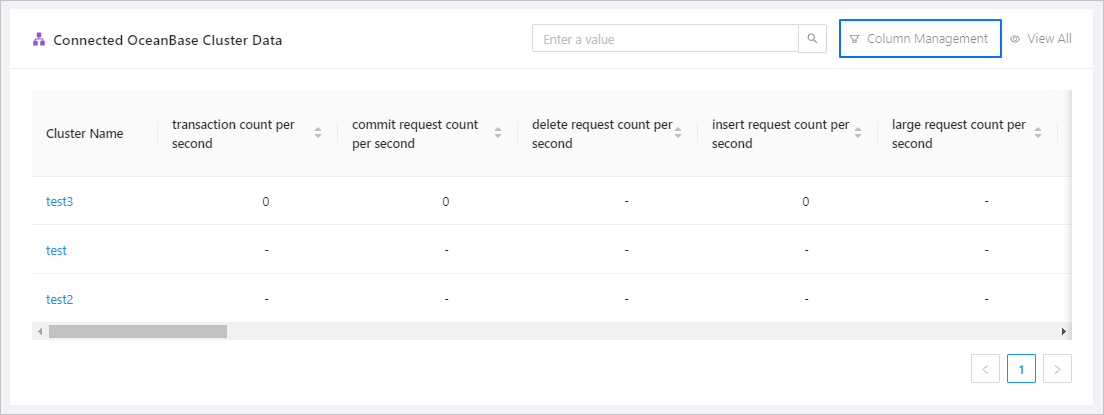
In the Connected OceanBase Cluster Data section, you can view the maximum, minimum, and average values of each metric. You can click Column Management to select the metrics to display. The columns include transactions per second, requests, connected clients, connected servers, SQL processing time, error response packets per second, routing table, and network request bytes.

In the OBProxy IP Address section, you can view the maximum, minimum, and average values of each metric. You can click Column Management to select the metrics to display. The columns include transactions per second, requests, connected clients, connected servers, SQL processing time, error response packets per second, routing table, and network request bytes.

System monitoring
On the System Monitoring tab, you can set the unit of the statistical period to Minute or Second . You can also select Last 30 Minutes, Last 1 Hour , or Custom Time for Duration .

You can turn on Real-time to view data updated in real time.

In the Overview section, click View All in the upper-right corner to view the Linux system load, CPU utilization, average I/O requests per second, average I/O time consumption, average I/O data amount, network throughput rate, memory, and disk usage.

In the OBProxy IP Address section, you can view the maximum, minimum, and average values of each metric. You can click Column Management to select the metrics to display. The columns include Linux system load, CPU utilization, average I/O requests per second, average I/O time consumption, average I/O data amount, network throughput rate, memory, and disk usage.


