TopSQL statements refer to the SQL statements that take the longest amount time to execute. On the tenant overview page, you can filter top SQL statements by time range and OBserver, and view the details of each top SQL statement in the list.
Procedure
In the left-side navigation pane, click Tenants and click a tenant in the Tenants list to go to the Overview page of the tenant.
In the left-side navigation pane, click SQL Diagnosis . The SQL Diagnosis page appears.
The SQL diagnostic data is not displayed on the SQL Diagnosis page if you do not set the values of both the cluster parameter enable_sql_audit and the tenant parameter ob_enable_sql_audit to True. You can click Change Cluster Parameters in the prompt box to modify the parameter values.

Click the TopSQL tab.
Filter the top SQL statements.
Specify the filter conditions
Time Range: You can select the last 5 minutes, last 10 minutes, last 20 minutes, last 30 minutes, last 1 hour, and last 3 hours from the drop-down list of the Time Range field. You can also select Custom Time from the drop-down list and specify the start time and end time as needed. By default, the information of the last 30 minutes is displayed.
OBServer: You can select an OBServer or All OBServers in the list. If you select an OBServer, only SQL statements executed on the selected OBServer are queried.
Internal SQL: If you select this option, the SQL statements internally initiated by OceanBase Database are displayed in the query result.
Keywords: The SQL statements that contain the specified keywords are displayed in the query result.
Advanced Search: You can select SQL ID , Executions , and Executions per Second from the drop-down list, and specify the values. The SQL statements matching the metric values are displayed in the query result.

Click Query to list all the SQL statements that meet the filter conditions.
Click Export to export all the SQL statements in the query result.
View TopSQL information
Click Column Management . In the dialog box that appears, select the columns to display. Then, you can view the selected columns in the TopSQL list.

On the TopSQL tab, you can view the selected columns that you want to display. You can copy the SQL text, filter it by database and user, and sort it by the number of executions, total response time, response time, and CPU time.
You can click the SQL text to go to corresponding SQL text page.
In the SQL Text section, you can click Copy or View All in the upper-right corner to copy or view all the SQL information.

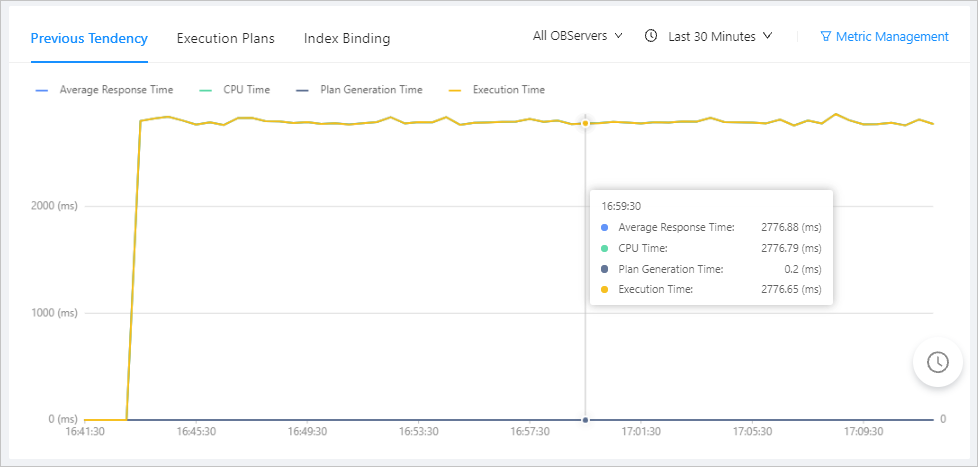
View previous tendency: You can view the previous tendency of SQL statements for different IP addresses and time ranges.

View execution plans: You can select the OBServers and time range to view details of execution plans. The table contains the following columns: Plan Hash , Merged Version , Execution Plan Type , Plan Generation Time , CPU Time , and Retrieval Rate . You can copy the Plan Hash string of a plan.

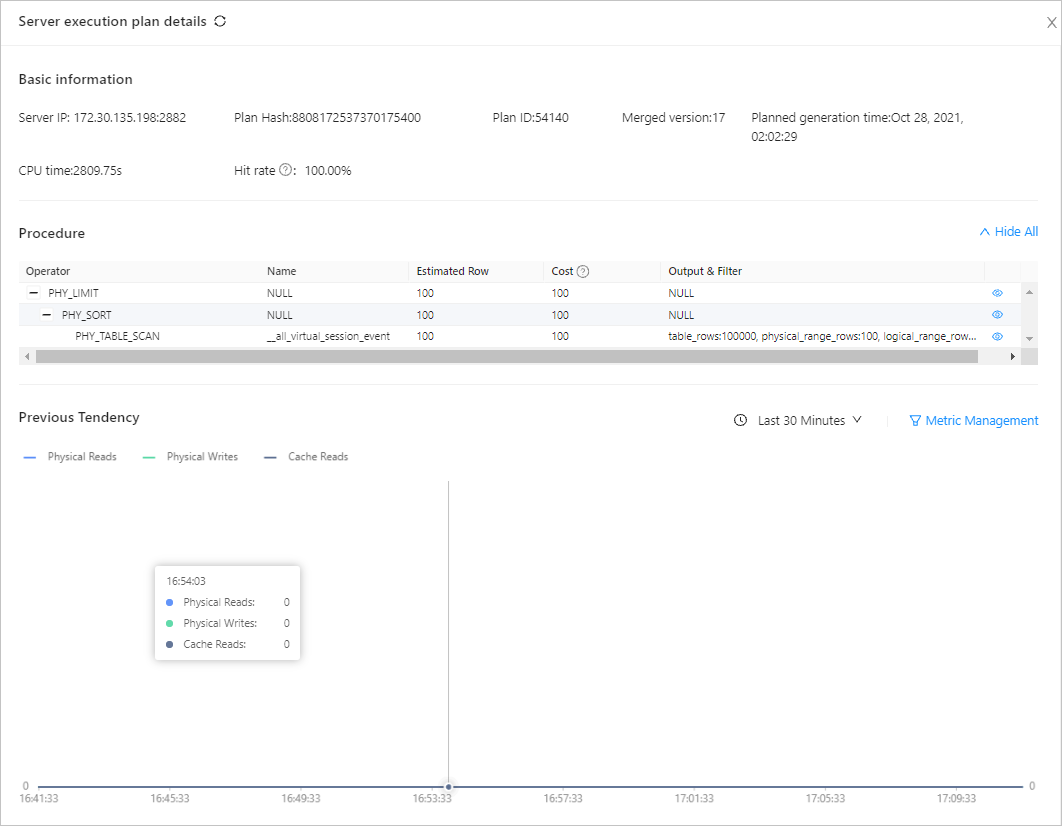
You can click the Plan Hash string of an execution plan to view its details.

On the details page of the plan, you can click the IP address in the Server IP column to view the execution details of the plan on this server.
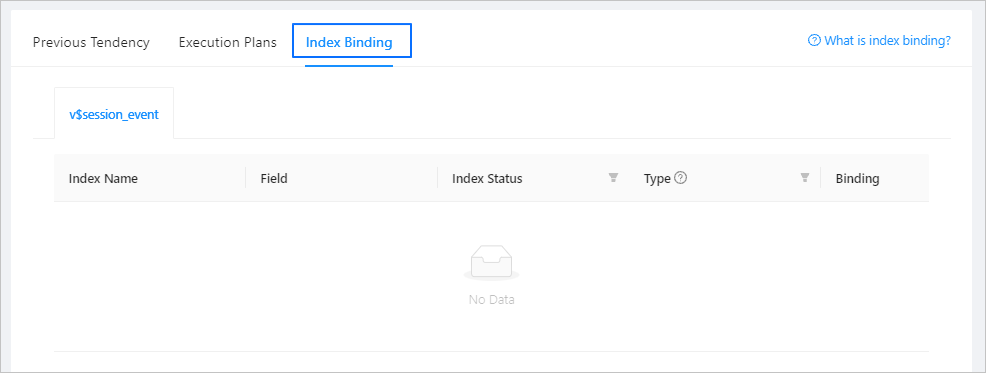
View index binding: You can filter the execution plans by indexing status and type. You can also click the button in the Binding column to bind an SQL statement to an index. You can create indexes in a command line tool or OceanBase Developer Center (ODC).
Note
The outline feature relies on the hint and plan cache features of OceanBase Database. The hint feature determines the selection of the physical plan generation path by specifying the index and the connection method. The plan cache caches physical plans for SQL statements. When the same SQL statement is executed again in the same environment, the system reads its execution plan from the plan cache. It does not have to go through the parser, resolver, rewriter, and optimizer modules again. This speeds up the execution of SQL statements. The outline feature uses hints to specify how to fix plans by modifying the physical execution plan in the plan cache.
OCP allows you to bind an index to an outline. You can bind an index to an SQL ID, so that OceanBase Database selects this index when it executes the SQL statement. At present, you can bind only one index to an SQL ID. For more information, see [Plan binding](https://www.oceanbase.com/docs/oceanbase-database/oceanbase-database/V2.2.30/plan-binding).


