


Terms
Transactions per second (TPS)
The number of messages pulled by the source per second.
Latency
The latency of the current task, in seconds. Security checkpoints are not considered when the latency is calculated.
ReadQ
In asynchronous transmission, the intermediate framework obtains data from ReadQ and writes the data to the destination. The data of the current process that is not obtained by the intermediate framework will be cached in ReadQ. The default maximum value of ReadQ is 4096. If the value of ReadQ is small, the source has no data or a bottleneck exists in pulling data from the source.
WriteConsume
The time required to write
{batch.size}, in milliseconds. A smallerWriteConsumevalue indicates higher performance of the destination.
Query metrics
Run the ./connector_utils.sh metrics command to query metrics.
./connector_utils.sh metrics

2022-09-22 12:49:48.876
SOURCE: [RPS:0.0, IOPS:0.0M, delay:1489ms]
SINK: [RPS:0.0, TPS:0.0, IOPS:0.0M, delay:2986440ms]
SINK_TIME: [execute_time:0.0ms/record, commit_time:0.0ms/batch]
SINK_SLOW_ROUTES:
SINK_THREAD: 4/4
DISPATCHER: wait record:0, ready batch:0, shardTime:nullms/record
forward_slot0 batchAccumulate: 0, recordAccumulate: 0
queue_slot1 batchAccumulate: 0, recordAccumulate: 0
heap:620M/1945M, noHeap:52M/488M, threadCount:18, cpu:0.054, sysCpu:51.555
ParNew(count:0, cost:0) ConcurrentMarkSweep(count:0, cost:0)
The parameters in the return result are described as follows:
SOURCE: provides theRPS,IOPS, andDELAYinformation.SINK: provides theRPS,TPS(RecordBatch/s),IOPS, andDELAYinformation.SINK_TIME:execute_time indicates the execution time of each record andcommit_timeindicates the batch execution time of multiple records.SINK_SLOW_ROUTES: the information aboutSINK_ROUTESwith a long execution time in internal statistics.SINK_ROUTESindicates units that support parallel writes, for example, partitions in a Kafka instance, shards in a DataHub instance, and queues in a RocketMQ instance.SINK_THREAD: Number of active sinkThreads/Maximum number of sinkThreads. If a few sinkThreads exist, the destination is idle and does not reach a bottleneck.DISPATCHERindicates the conditions of the intermediate queue,wait recordindicates the number of messages waiting to be allocated, and ready batch indicates the number of records to be executed by sinkThreads.If the value of
wait recordis large, a large number of messages exist, which may be affected by garbage collection (GC).If a large number of records are to be executed, the destination encounters a bottleneck. In this case, you can try to increase the write speed of the destination. For example, you can increase threads.
{Name of the framework queue} batchAccumulate: {Number of accumulated records for batch execution},recordAccumulate: {Number of accumulated records}If
batchAccumulatof the first queue is empty, the source encounters a bottleneck and no messages can be received by the source.If
batchAccumulateof the last queue is full, the record dispatcher (conflict matrix/hash) encounters a bottleneck. In this case, you must view the metrics of the dispatcher.
heap: Heap memory usage/Maximum heap memory size,noHeap: Non-heap memory usage/Maximum non-heap memory size,threadCount: number of threads,cpu: process CPU, andsysCpu: system CPU.{Time} {youngGcName}(
count:{Accumulated number of times},cost:{Accumulated consumed time}) {fullGcName}(count:{Accumulated number of times},cost:{Accumulated consumed time})
Incr-Sync/Full-Import diagnostics
Obtain the ID of the Incr-Sync or Full-Import component.
Log on to the OceanBase Migration Service (OMS) console.
In the left-side navigation pane, click Data Migration.
On the Migration Projects page, click the name of the data migration project that you want to view to go to the details page.
Click View Component Monitoring in the upper-right corner.
In the View Component Monitoring dialog box, view the ID of the Incr-Sync or Full-Import component.
Enter the directory of the Incr-Sync or Full-Import component.
Log on to the server where OMS is deployed.
Run the following command to enter the Docker container.
docker exec -it ${CONTAINER_NAME} bashRun the command to enter the directory of the component.
cd /home/ds/run/${the component ID}
Run the
./connector_utils.sh diagnosecommand in the directory of the Incr-Sync or Full-Import component to perform diagnostics../connector_utils.sh diagnose -s 'YYYY-MM-DDTHH:mm:ss' -e 'YYYY-MM-DDTHH:mm:ss'In the preceding command,
-sand-eare optional.-sindicates the time when the log analysis starts and-eindicates the time when the log analysis ends. Specify the timestamp in the 'YYYY-MM-DDTHH:mm:ss' format, such as '2023-06-01T12:00:00'.By default, the value of
./connector_utils.sh diagnoseis 10 minutes and that of-eis the current time.Here is a sample command output:
[Metrics]
TPS: [last:345,avg:277.28,p99:911.00]
RPS: [last:106,avg:257.08,p99:968.00]
IOPS: [last:2KB,avg:21.33KB]
EXECUTE_TIME: [last:34ms,avg:220.44ms,p99:783.00ms]
SINK_DELAY: [last:19ms,avg:260.31ms,p99:819.00ms]
SOURCE_DELAY: [
source_subtopic2_source_delay: [last:702ms,avg:525.00ms,p99:986.00ms]
source_subtopic1_source_delay: [last:14ms,avg:490.69ms,p99:973.00ms]
]
QUEUE_BATCH_ACCUMULATE: [
frame_queue_slot_1.batchAccumulate: [last:420,avg:496.00,p99:975.00]
frame_queue_slot_2.batchAccumulate: [last:310,avg:470.05,p99:975.00]
]
JVM-MEM: heap:34.28M/3641M, noHeap:19.38M/0M]
THREAD: [count:4, sink:14/16]
CPU: [last:17,avg:27.95,p99:62.00]
[Pref]
sink block: true
youngGc: true
[Suggest]
config[coordinator.shuffleMinBatchSize]:20 to 40
config[coordinator.shuffleMaxBatchSize]:40 to 80
jvm to: -Xmx4096m
The parameters are described as follows:
The
Metricsinformation is used for making judgments.The
Prefinformation indicates the bottleneck that you can analyze based on the metrics.The
Suggestinformation indicates the points for improvement. In the preceding example, you can update theshuffleMinBatchSize,shuffleMaxBatchSize, andconnectorJvmParamparameters in thecoordinatorsection of the Incr-Sync or Full-Import component.
workerNum
The
workerNumparameter reaches the maximum value allowed, and the values of theexecuteTimeandcommitTimeparameters in thesinksection in themetricslog are acceptable.On the project details page, click View Component Monitoring.
In the dialog box that appears, click Update in the Actions column of the component that you want to modify.
In the Update Configuration dialog box, move the pointer over the
workerNumparameter in thesinksection and click the edit icon that appears.If the parameter does not exist, move the pointer over the blank area next to the
sinksection and click the Add icon that appears to add theworkerNumparameter.Set the
workerNumparameter to a larger value based on the server resources.Modify the value in the text box and then click the Confirm icon.
In the Update Configuration dialog box, click OK.
The
workerNumparameter has not reached the maximum value, but the GC time between two operations is very long in theMetricssection in the command output.On the project details page, click View Component Monitoring.
In the dialog box that appears, click Update in the Actions column of the component that you want to modify.
In the Update Configuration dialog box, move the pointer over the
splitThresholdparameter in thesourcesection and click the edit icon that appears.If the parameter does not exist, move the pointer over the blank area next to the
sourcesection and click the Add icon that appears.Set the
splitThresholdparameter to a smaller value. The default value is128.Modify the value in the text box and then click the Confirm icon.
In the Update Configuration dialog box, click OK.
When the value of
workerNumis1or2, theconflictKeyordeepSizekeyword is recorded in theconnector.logfile.On the project details page, click View Component Monitoring.
In the dialog box that appears, click Update in the Actions column of the component that you want to modify.
In the Update Configuration dialog box, move the pointer over the blank area next to the
coordinatorsection and click the Add icon that appears.Enter
hotKeyMergeforKey Nameand click the Confirm icon.In the Update Configuration dialog box, find the new key name. Its default value is NULL.
Move the pointer over the new parameter, click the edit icon that appears, change the value of the parameter to
trueand then click the Confirm icon.In the Update Configuration dialog box, click OK.
Excessively long GC time
Note
If Young GC (YGC) per second exceeds 300 ms and Full GC (FGC) happens each second, it is considered that the GC time is excessively long.
View GC details
In the task directory, run the following command to view the GC details of each second:
/opt/alibaba/java/bin/jstat -gcutil `cat task.pid` 1s
Increase the JVM memory: Move the pointer over the
connectorJvmParamparameter in thecoordinatorsection and change the value to-Xms12g -Xmx16g.The value here is for reference only. You must adjust the value based on the memory of the current server.`` If the parameter is already used, you can remove
-Xmn.Data synchronization and full migration: Move the pointer over the
bridgeQueueSizeparameter in thecoordinatorsection and decrease the value of this parameter. The default value is256. You can decrease the value to32.Synchronization to Kafka: Move the pointer over the
lingerMsparameter in thesinksection and set the parameter to1.Move the pointer over the
throttleMemoryBoundparameter in thecoordinatorsection and set the parameter to a value in bytes to limit the memory size. We recommend that you set the value to 1/4 of the maximum memory.For example, if the maximum heap memory is 16 GB, we recommend that you set this parameter value to
16 × 1024 × 1024 × 1/4 = 4294967296.If
dispatcherClassNameinconf/coordinator.jsonorconf_new/coordinator.jsonisShuffleRecordDispatcher, you can modify the following parameters of the coordinator:maxRecordCapacity = 1000specifies the total number ofdispatcherqueues. The default value is subject toshuffleMinBatchSize *(shuffleBucketSize* 1.5) = 3840.Set the
shuffleBucketSizeparameter to32. This operation decreases the number of batch buckets. The default value is128.Set the
shuffleFlushIntervalMsparameter to10to accelerate the data push to the destination.
Move the pointer to the blank area next to the
sinksection and add theworkerNumparameter. The default value is16. The maximum value is64.
Batch-related parameters
Notice
Batch-related parameters apply only to the incremental synchronization link of a non-database destination.
Perform tuning based on the GC information:
When GC is not serious, increase the number of batches within the capacity of the destination.
Decrease the number of batches during GC verification.
maxRecordCapacity: the maximum number of batch queues. Default value:16000.shuffleMinBatchSize: the minimum number of batches. Default value:20.shuffleMaxBatchSize: the maximum number of batches. Default value:64.shuffleFlushIntervalMs: The refresh time. Default value:100ms.shuffleBucketMaxInFlightBatchSize: the maximum number of ongoing batches allowed in each concurrent operation. The default value is1for incremental migration and is not limited for full migration.shuffleBucketSize: the maximum number of concurrent batches.
Data is delivered when the shuffleMaxBatchSize || shuffleFlushIntervalMs condition is met and the write threads are capable of writing.
Latency information required
Latency information on the GUI. The following figure shows the latencies of the project, the Store component, and the Incr-Sync component of a project.
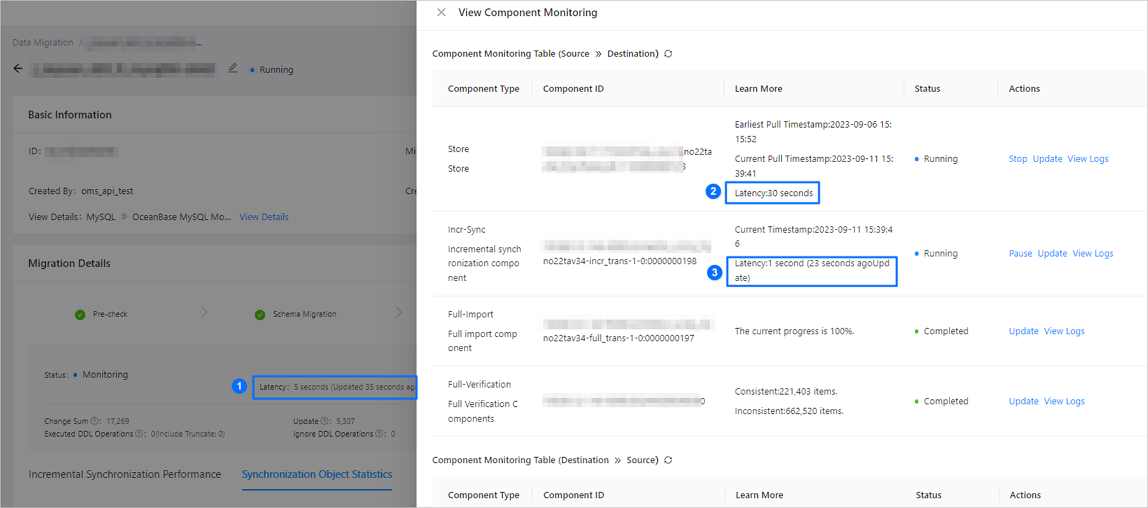
As shown in the preceding figure, a data migration or synchronization project involves latencies of multiple types of objects.
No.Latency typeDescription1 Project latency - The latency of a data migration or synchronization project depends on that of the Incr-Sync component. If multiple Incr-Sync components exist, the project latency is determined by the longest Incr-Sync latency.
- The latency of a data migration or synchronization project and that of a component are calculated based on different scheduling and storage resources and may be different. For example, a large number of projects or prolonged scheduling time may cause the displayed latency of a project to be greater than that of a component.
2 Store latency The difference between the current time and the time when the Store component fetches the changed record. The latency calculation involves polling. In general, the polling time ranges from 10 to 30 seconds. 3 Incr-Sync latency The difference between the current time and the minimum change time of the record written to the destination. The latency calculation involves polling. You can learn the polling time based on the number of seconds in parentheses, in the Latency Refreshed At column, that indicates the time elapsed since the last update. Metrics information of the Incr-Sync component. For more information, see the "Query metrics" section in this topic.
We recommend that you provide a package of the
logsandconfdirectories of the Incr-Sync component.