


This topic describes how to debug a stored procedure in OceanBase Developer Center (ODC).
Background information
PL program development is important daily work for database service developers. Same as the support module for SQL statements, the PL debugging module is also of great significance. Therefore, developers require a PL development area and a debugging feature during programming.
ODC V2.2.0 and later versions support the creation, compilation, running, and debugging of PL objects and anonymous blocks. In the editing area of the anonymous block window, you can compile PL statements, and edit and debug created PL objects. ODC provides features such as Batch Execute, Step Over, Step Into, Step Out, Abort Debugging, Debug Again, and Exit Debugging for debugging PL objects. ODC also provides tab pages for displaying debugging information, for example, Parameters, Stacks and Variables, DBMS Output, Breakpoints, and Debugging Logs.
Prerequisites
The database is OceanBase Database V2.2.70, V3.0.00, or a later version in Oracle mode.
The debugging feature is unavailable if you connect ODC to the target instance by using OBProxy. To use the debugging feature, directly connect ODC to the target instance.
You have installed the debugging packages such as DBMS_DEBUG and DBMS_OUTPUT in the connected database.
You have created a sample stored procedure named procedure_test by using the following sample script:
CREATE OR REPLACE PROCEDURE procedure_test
(
  A IN NUMBER,
  B IN NUMBER,
  C OUT NUMBER
) IS
BEGIN
  C:= A + B;
  dbms_output.put_line ( C / 2  ) ;
END procedure_test;
Procedure
The result of procedure_test is the value obtained by dividing the value of output parameter C by 2. The value of parameter C is equal to the sum of values of parameter A and parameter B. Therefore, you cannot directly learn of the value of parameter C from the output result of the program. You can view and verify the actual value of parameter C during program running by debugging procedure_test.
Enter the debugging mode.
After you enter the connection, find the target stored procedure procedure_test in the stored procedure list in the left-side navigation pane. Then, right-click procedure_test and click Debug in the shortcut menu to start debugging. You can also click Edit in the shortcut menu to go to the object editing page, and then click Debug in the toolbar to start debugging.
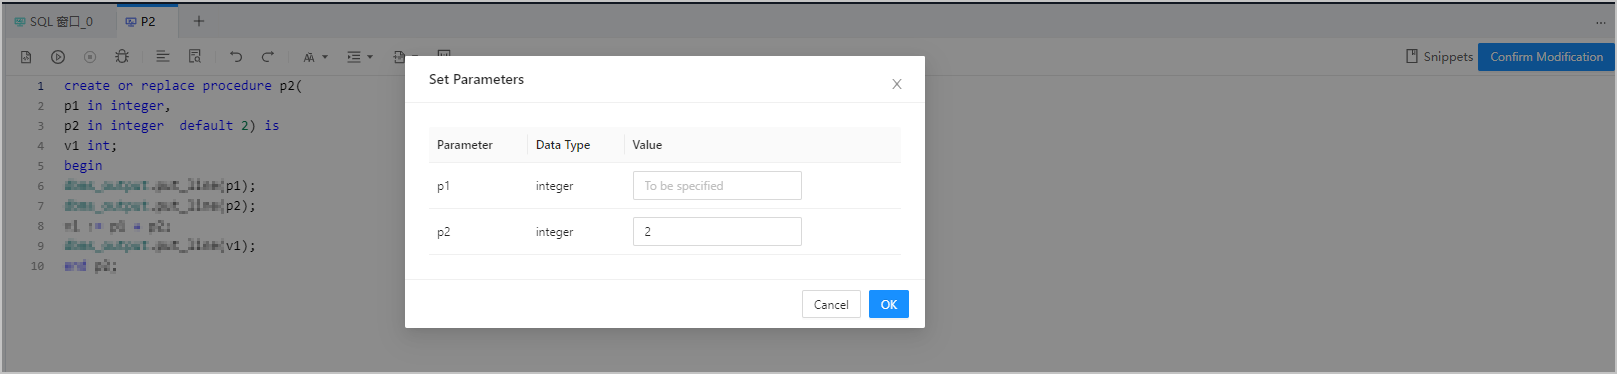
Set parameters.
procedure_test has three parameters: input parameters A and B, and output parameter C. If the input parameters already exist, you need to set the values of the input parameters first and then start debugging. When you start the debugging, ODC will first display the Set Parameters page for you to set values of the input parameters. In this example, the value of parameter A is set to 2 and the value of parameter B is set to 4. After you set the values, click OK on the Set Parameters page.
Go to the debugging page.
The debugging page appears after you set the parameters. The Parameter tab below the editing area of the debugging page displays the definition information of all the parameters configured for the program. The definition information includes the parameter name, mode, and type. The values of the parameters may change accordingly in the debugging process.
ODC provides the following buttons in the toolbar of the debugging page:
Set breakpoints.
A breakpoint allows the program stop at the specified position during execution, to facilitate program analysis. You can set a breakpoint in ODC by clicking a line number in the editing area. In the sample program, click the line number of the
dbms_output.put_line ( C / 2 );statement in the ninth line to set a breakpoint. The Breakpoints tab below the editing area displays information such as the PL object name and line number of all breakpoints set in the program. You are also allowed to Cancel and View breakpoints.Start the debugging.
After you set the breakpoints, click Batch Execute in the toolbar. The debugging begins, and stops at the breakpoints. You can also click Step Over to execute the program statements step by step. One step is executed when you click this button once.
View the debugging information.
The program now stops at the ninth line. You can view the variables on the current stack and their values on the Stacks and Variables tab below the editing area. The program stops at the ninth line because of the breakpoint. So, on the Stacks and Variables tab, you can find that the value of variable C is 6. You can also view the records and error logs of actions such as starting debugging, aborting debugging, adding breakpoints, and canceling breakpoints on the Debugging Logs tab.
Abort the debugging.
Click Abort Debugging in the toolbar. The program will continue to run till the end and skip subsequent breakpoints. The program contains PL output statement
dbms_output.put_line. Therefore, when the program stops, the DBMS Output tab below the editing area displays the value obtained by dividing the value of parameter C by 2. The value now displayed on the tab is 3, indicating that no error has occurred during the running of the program.Debug again.
After the program running ends, you can click Debug Again in the toolbar to debug the current object again. The information and breakpoints of the previous debugging will be cleared. You can reset parameters and start a new round of debugging.
Exit the debugging.
After you finish the program analysis based on the debugging, you can click Exit Debugging in the toolbar to exit the debugging page.