


Transaction errors may occur both in an internal test environment and in a running OceanBase cluster. This topic describes common transaction errors and provides troubleshooting methods.
Applicable versions
The solution provided in this topic is applicable to all versions of OceanBase Database.
Symptom
When OceanBase Database is running, it executes database transactions and returns the execution results to the client that sends the request. If the transaction execution fails or encounters an exception, an error is reported. Common transaction errors are classified into two types: errors that are displayed to the client during transaction execution and environment exceptions identified by using logs or memory tables.
Troubleshooting logic
To troubleshoot common transaction errors, query the __all_virtual_trans_stat table and view logs in the observer.log file.
Query the __all_virtual_trans_stat table
You can query the table to obtain the context status of transactions that are not terminated. The following table describes the main columns in the virtual table.
Column name |
Description |
|---|---|
| svr_ip | The IP address of the OBServer node that creates the transaction context. |
| session_id | The unique ID of the session to which the transaction context belongs. |
| proxy_id | The IP address and port number of the ODP or Java Client. |
| trans_id | The unique ID of the transaction. |
| is_existing | Indicates whether the current transaction context is exiting. |
| partition | The partition on which the current transaction context is created. |
| participants | The list of participants in the current transaction. |
| ctx_create_time | The point in time when the transaction context was created. |
| ref | The reference count of the transaction context. |
| sql_no | The sql_no of the last SQL statement that is executed on the current transaction context. |
| state | The current status of the transaction context. Valid values: INIT, PREPARE, COMMIT, ABORT, and CLEAR. |
| part_trans_action | The last action executed on the transaction context. Valid values: START_TASK, END_TASK, and COMMIT. |
| lock_for_read_entry_count | The number of retries when the transaction encounters row lock contention during table scanning. |
Note
The __all_virtual_trans_stat table contains the context of participants in transactions that are not terminated in both the primary cluster and standby clusters. You need to collect the information of all transaction participants to confirm the execution status of the current transaction.
View logs in the observer.log file
Use the
trace_idto search logs within a specified period of time in theobserver.logfile.A trace log displays all logs related to the execution of a statement. For example, the search of
trace_id=Y404645869E7-0005A852503E9F53in theobserver.logfile returns the following results:observer.log.20200618102440:[2020-06-18 10:24:38.213870] WARN [STORAGE.TRANS] set (ob_memtable.cpp:354) [509976][2170][Y404645869E7-0005A852503E9F53] [lt=10] [dc=0]Use the
trans_idobtained from the __all_virtual_trans_stat table to search for all logs related to the transaction.Example:
trans_id:{hash:16713812224872761916, inc:334222, addr:{ip:"xxx.xxx.xx.xxx", port:xxxx}, t:1588070679938314}. Thehashfield indicates the hash value of the transaction ID. As the hash value is unique, you can use it as the unique transaction ID for log searching. Theaddrfield indicates the IP address of the OBServer node that starts the transaction, and thetfield indicates the start time of the transaction.
You can locate errors based on alerts or error messages in logs.
Troubleshooting procedure
To locate a problematic transaction and the cause of the error, use the trans_id obtained from the __all_virtual_trans_stat table to search for logs.
In most cases, OceanBase Database uses an error packet to identify the SQL statement that returns an error. The following sample log shows an SQL error:
observer.log.20200727141140:[2020-07-27 14:11:39.217574] INFO [SERVER] obmp_base.cpp:1189 [68642][2036][YCB200BA65045-0005AB63DE657563] [lt=7] [dc=0] sending error packet(err=-4038, bt="0xb87c095 0x748e365 0x80358b4 0x74aaa46 0x802efac 0x802abff 0xb9c269d 0x809cfaa 0x809c64c 0x80984c1 0x8097819 0x30ee977 0x30ee81c 0x2b9ba7d 0xb67f8f3 0xb67d664 0xb67c7ee", extra_err_info=NULL)
The err field indicates the error. The number of 4038 is the corresponding error code.
OceanBase Database classifies error codes for transactions into the following types: transaction rollback, execution timeout, lock wait timeout, and others. You can troubleshoot errors based on different error codes.
Transaction rollback
The following table describes four error codes for transaction rollback.
MySQL error code |
Error code in OceanBase Database |
Error message |
|---|---|---|
| 6002 | 6224 | transaction need rollback |
| 6002 | 6223 | transaction exiting |
| 6002 | 6211 | transaction is killed |
| 6002 | 6213 | transaction context does not exist |
If one of the preceding errors is reported, a transaction is rolled back. Transaction rollback is not necessarily an exception. In OceanBase Database, a transaction is rolled back if the transaction times out or the primary cluster of the participant is changed. In these cases, transaction rollback is normal. However, you can still troubleshoot transaction rollback as needed.
To troubleshoot transaction rollback, perform the following steps:
Locate the OBServer node that starts the transaction.
Direct client connection
The IP address of the connection is the IP address of the OBServer node that starts the transaction.
Non-direct client connection
You need to query the ODP log and obtain the
server_trace_idandserver_ipfrom the results to locate the OBServer node that starts the transaction.[2020-06-16 03:30:01.224301] WARN [PROXY.SM] print_mysql_complete_log (ob_mysql_sm.cpp:3026) [105108][Y0-7F5E9AC56310] [lt=30] [dc=0] finishing mysql tunnel((sm_id=799, cs_id=3244036, proxy_sessid=7230649605627118303, ss_id=5594, server_sessid=3222037518, client_ip={xx.xx.xx.xx:56253}, server_ip={xxx.xxx.xx.xxx:xxxx}, server_trace_id=Y404645869E7-0005A852503E9F53, proxy_user_name=test@xyoracle#ob96.hudson, database_name=TEST, is_flow_controlled=false, cpu_flow_control_count=0, memory_flow_control_count=0, sql=SELECT d_tax, d_next_o_id FROM bmsql_district WHERE d_w_id = 706 AND d_id = 10 FOR UPDATE, sql_cmd="Query", result={is_trans_completed:false, is_resp_completed:true, ending_type:2, is_partition_hit:false, has_new_sys_var:false, has_proxy_idc_name_user_var:false, is_server_db_reset:false, reserved_len:0, connection_id:0, scramble_buf:"", is_resultset_resp:false, server_capabilities_lower_.capability:0, ok_packet_action_type:2, last_ok_pkt_len:86, rewritten_last_ok_pkt_len:0, error_pkt:field_count:255, errcode:1205, sqlstate:"HY000", message:"Lock wait timeout exceeded; try restarting transaction"})
Query the __all_virtual_trans_stat table, obtain the
trans_id, and then use thetrans_idto search for logs in theobserver.logfile.grep "transaction killed success" *To identify the cause of forced termination of a transaction, search for the following two logs:
If you find the
leader revokelog, transaction rollback is triggered by a follower-to-leader switchover. Run the following command to search for theleader revokelog:grep "participant leader revoke" *If the value of the
trans_expired_timefield is earlier than or equal to the point in time when the transaction is rolled back, transaction rollback is triggered by transaction timeout. Run the following command to search for thetrans_expired_timelog:grep "trans_expired_time" *
Execution timeout
The following table describes two error codes for execution timeout.
MySQL error code |
Error code in OceanBase Database |
Error message |
|---|---|---|
| 4012 | 6212 | Statement is timeout |
| 4012 | 6210 | Transaction is timeout |
The statement timed out.
Check the value of the
ob_query_timeoutvariable of the tenant. Then, use thetrace_idto search for logs in theobserver.logfile and obtain thecur_query_start_timeof the statement. If the difference between the timeout timestamp and thecur_query_start_timeequalsob_query_timeout, the results are expected. Otherwise, contact OceanBase Technical Support.The transaction timed out.
Check the number of SQL statements in the transaction, whether retries recur, and whether accumulation occurs in the tenant queue. To check whether accumulation occurs in the tenant queue, search for the
dump tenantkeyword.
Retries of failed statement execution also cause transaction timeout. The following table describes three related error codes.
MySQL error code |
Error code in OceanBase Database |
Cause |
|---|---|---|
| 4038 or 4225 | 4038 or 4225 | The partition or its leader does not reside in the OBServer node that starts the transaction. A few retries are acceptable. If retry failures persist, contact OceanBase Technical Support. |
| 4038 or 4225 | 4653 or 4654 | During statement execution, no location information is found when a table plan is generated. A few retries are acceptable. If retry failures persist, contact OceanBase Technical Support. |
| 4038 or 4225 | 6005 | Row lock contention occurs during execution. You must analyze the transaction that holds the row lock to check whether the transaction is executed as expected. |
Lock wait timeout
The following table describes two error codes for lock wait timeout.
MySQL error code |
Error code in OceanBase Database |
Error message |
|---|---|---|
| 6004 | 6004 | Shared lock conflict |
| 6003 | 6003 | Lock wait timeout exceeded; try restarting transaction |
A lock wait timeout results from a statement execution timeout. Before you troubleshoot a lock wait timeout, follow the methods described in the preceding section to check whether the statement timeout period is set in an appropriate manner. If yes, check whether the transaction that another transaction waits for remains unterminated for a long period of time.
If
Shared lock conflictis reported, a read request is waiting for the commit of another transaction.You can search the following logs for unterminated transactions. The
conflict_ctxfield indicates the context of the transaction that holds the row lock. Therowkey_objectfield indicates the locked row.grep "lock_for_read fail" * observer.log:[2020-06-19 19:36:00.681313] WARN [STORAGE.TRANS] lock_for_read (ob_mvcc_row.cpp:1120) [39644][3862][Y72F564587653-0005A86771DBF02A] [lt=22] [dc=0] lock_for_read fail((ret=-6004, ctx=alloc_type=0 ctx_descriptor=7941866 ... pkey={tid:1102810162659511, partition_id:0, part_cnt:0} trans_id={hash:10466628054523668402, inc:4098058, addr:"xx.xx.xx.xx:29429", t:1592566558782644} data_relocated=0 relocate_cnt=0 truncate_cnt=0 trans_mem_total_size=0 callback_alloc_count=0 callback_free_count=0 callback_mem_used=0 checksum_log_id=0, *key=table_id=1102810162659511 rowkey_object=[{"BIGINT":1003},{"BIGINT":1102810162709409},{"BIGINT":519}, {"VARCHAR":"xx.xx.xx.xx", collation:"utf8mb4_general_ci"},{"BIGINT":29429}] , conflict_id=3155625, conflict_ctx="alloc_type=0 ctx_descriptor=3155625 trans_start_time=1592541786500368 min_table_version=640 max_table_version=640 ... stmt_timeout=1897924 abs_lock_wait_timeout=1592541788399623 row_purge_version=0 lock_wait_start_ts=0 trx_lock_timeout=-1 end_code=0 is_readonly=false ref=0 pkey={tid:1102810162659511, partition_id:0, part_cnt:0} trans_id={hash:13185011132747685805, inc:1187948, addr:"xx.xx.xx.xx:29429", t:1592541786499600} data_relocated=0 ...)If
Lock wait timeout exceededis reported, a transaction is waiting for the row to be unlocked.You can run the following command to search for the
dump tenantkeyword in the log file. Theconflict_ctxfield indicates the context of the transaction that holds the row lock.grep "dump tenant" observer.log
Other transaction errors
The following table describes six error codes for other transaction errors.
MySQL error code |
Error code in OceanBase Database |
Error message |
|---|---|---|
| 4013 | 4013 | No memory or reach tenant memory limit |
| 4030 | 4030 | Over tenant memory limits |
| 4121 | 4121 | RPC send error |
| 4122 | 4122 | RPC post error |
| 4124 | 4124 | Connect error |
| 4019 | 4019 | Size overflow |
Error codes 4013 and 4030
You can run the following command to search for the
MEMORYkeyword and locate the error:grep "MEMORY" *Error codes 4121, 4122, and 4124
You can run the following command to search for the
EASY SLOWkeyword to check whether the error is caused by network latency. If a large number of logs are returned, network latency occurs.grep "EASY SLOW" *Error code 4019
If 4019 is reported, a deadlock may occur in OceanBase Database. You need to run the
pstackcommand to analyze processes.
Transactions that remain unterminated
The following three types of transactions may remain unterminated:
Transactions that are not being committed
Query the
__all_virtual_trans_stattable of a transaction. If the value of thestatefield is0, the transaction is not being committed. Possible causes of a transaction that remains unterminated in the non-commit phase:Prolonged execution of a large query
Check the
part_trans_actionfields in all the contexts of the transaction. If the value of a field is1, prolonged execution of a large query exists. If the value of thepart_trans_actionfield is2, the execution of the current statement is not retried after an error is reported or the next statement is not executed. You can troubleshoot this issue in the following two ways:Tenant queue accumulation
Use the
dump tenantkeyword to check whether the tenant queue is accumulated. If yes, check whether resource configurations for worker threads are appropriate. If yes, the accumulation is likely caused by a deadlock. You need to troubleshoot the deadlock by running the pstack command to analyze observer processes.No tenant queue accumulation
In this case, it is possible that the client does not initiate the next statement or the client cannot initiate the next statement because the OBServer node does not return the packet. Check for deadlocks. If the statement keeps retrying due to execution errors, you can use the
trans_idto find the cause of retries in the transaction log and check whether the cause is expected.
Transactions that are being committed
Query the
__all_virtual_trans_stattable of a transaction. If the value of thestatefield is not0or the value of thepart_trans_actionfield is3, the transaction is being committed.You can perform the following steps to troubleshoot a transaction that is being committed:
Use the
trans_idto query the__all_virtual_trans_stattable and check the contexts of all participants. The participant that has the smalleststatevalue is the one that remains in the commit phase.Locate the participant and use the
trans_idto search for relevant context logs.The following figure shows the transaction logs of a participant.
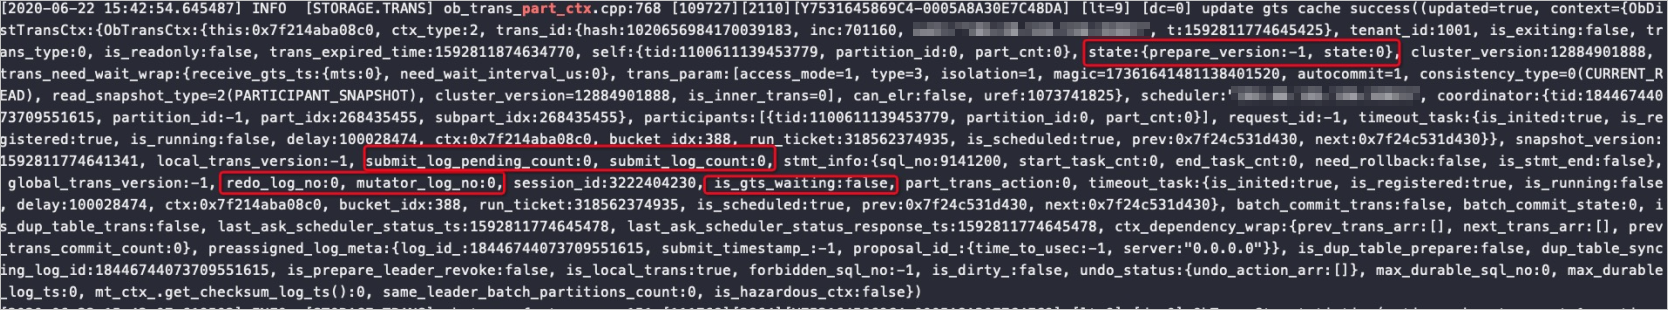
Take note of the fields in red boxes in the figure. The following table describes the fields.
FieldDescriptionIssueis_gts_waiting:true Waits for the latest GTS during the commit of logs. An error occurred when the system refreshes the GTS. is_submig_log_pending_count:0is_submit_log_count:1 No clog callback after transaction logs are committed to clog. This indicates that the sliding window times out. A majority of replicas may have errors. Possible causes: full disk usage, network failure, or memory overrun. is_submig_log_pending_count:1is_submit_log_count:1 The transaction log commit task is waiting in the asynchronous commit queue. The sliding window times out or the sliding speed is too low. a. The first type of exceptions may occur if the
__all_dummytable does not have the primary key. The__all_dummytable provides GTS for the current tenant. You can use the following method for troubleshooting:The
$dummy_idcan be calculated by using>>> $tenant_id << 40 | 135. The$tenant_idis the ID of the tenant.grep "$dummy_id" election.logb. For the other two types of exceptions, you can query the
_all_virtual_clog_stattable, and check whether the partition is leaderless or whether the value of theis_in_syncfield for the majority of replicas is 0.
Transaction contexts that remain unterminated in the playback phase
Query the
__all_virtual_trans_stattable. If the value of thectx_create_timefield equals that of theexpired_timefield, the transaction context is in the playback phase.In this case, you need to use the
partitionfield to locate the IDC to which the partition leader belongs. If the participant context of the leader is terminated, the current transaction remains unterminated because the standby IDC is not synchronized.You can query the
__all_virtual_clog_stattable and check thelast_log_idfield to determine whether replica logs lag behind.
Session disconnection
A session can be disconnected because of the following two causes:
The value of the
ob_trx_idle_timeoutparameter is exceeded.For more information about the
ob_trx_idle_timeoutparameter, see "System variables" in OceanBase Database Reference Guide.The session cannot handle the current exception.
To troubleshoot the session disconnection, perform the following steps:
Search for the
session is killkeyword to locate thesession_idthat returns the error.$ grep 'session is kill' observer.log.2* observer.log.20200908141837:[2020-09-08 14:14:50.416162] WARN [SQL.SESSION] set_session_state (ob_basic_session_info.cpp:4084) [4830][0][Y0-0000000000000000] [lt=9] [dc=0] session is killed(ret=-5066, sessid_=3222146964, proxy_sessid_=0, version_=0, state=4) observer.log.20200908141837:[2020-09-08 14:14:50.416418] WARN [SQL.SESSION] set_session_state (ob_basic_session_info.cpp:4084) [4832][0][Y0-0000000000000000] [lt=8] [dc=0] session is killed(ret=-5066, sessid_=3222146965, proxy_sessid_=0, version_=0, state=4) observer.log.20200908144919:[2020-09-08 14:46:30.425385] WARN [SQL.SESSION] set_session_state (ob_basic_session_info.cpp:4084) [4825][0][Y0-0000000000000000] [lt=10] [dc=0] session is killed(ret=-5066, sessid_=3222154297, proxy_sessid_=0, version_=0, state=4)Use the
session_idto find and analyze the error.