


This topic describes how to troubleshoot memory overrun.
Symptom
If the memory usage of a tenant in a cluster exceeds the upper limit or an exception occurs, the client returns an error message: Over tenant memory limits. The error code is 4030 or 4013. OceanBase Cloud Platform (OCP) receives a log alert shown in the following figure:
After you receive the alert, you need to log on to the sys tenant of the OceanBase cluster where the object that triggers the alert resides, and locate the cause.
Troubleshooting logic
In most cases, a tenant memory usage exception is related to user behaviors, such as slow SQL queries, large transactions, and improper configurations. Therefore, you can locate the cause by using the performance trend and SQL monitoring features of OCP. If you cannot eliminate the exceptions due to common causes, contact OceanBase Technical Support.
Check tenant performance trends
Before you check the tenant-level performance monitoring information, log on to the OCP console as the sys tenant of the cluster, obtain the value of tenant_id from the error log, and run the following SQL statement to obtain the name of the tenant for which the memory usage alert is reported. In the log alert in the preceding figure, tenant_id is 1006. The corresponding SQL statement is:
obclient> SELECT tenant_name FROM __all_tenant WHERE tenant_id IN (1006);
After you obtain the name of the tenant, go to the Performance Monitoring page for the tenant in OCP. For more information, see Monitor and diagnose the tenant performance.
Pay attention to the QPS, Response time, TPS, Transaction response time, and MemStore metrics on the Performance Monitoring page of the tenant. Identify the point in time when the alert was triggered, and check whether the alert is triggered due to the estimated causes. Usually, variations of the preceding monitoring metrics near the occurrence time of the alert may encompass the following cases:
The transaction response time suddenly increases significantly, while other metrics show no obvious changes. In addition, the MEMStore metric is below the threshold for a major compaction. This indicates that large queries exist and that the large queries have consumed memory exceeding the specified threshold, thus triggering the alert.
The transaction response time suddenly increases significantly, and the response time also increases, but other metrics do not change much. In addition, the MEMStore metric is below the threshold for major compaction. This indicates that the tenant has executed some large transactions, which have consumed memory exceeding the specified threshold, thus triggering the alert and affecting the query performance.
Both QPS and TPS decrease, but the transaction response time increases, while the MEMStore metric has reached the threshold for a major compaction but does not drop. This indicates that the memory of the tenant cannot be released through minor compactions or major compactions. The log alert is probably caused by a minor compaction exception or a major compaction exception. For more information, see Troubleshoot major compaction exceptions.
Check SQL monitoring information
If the log alert is caused by large queries or large transactions but not major compaction exceptions, use the SlowSQL monitoring feature in OCP to identify the root cause.
Troubleshooting methods
If the memory of a tenant is insufficient, check whether the issue is generated due to common causes such as slow SQL queries, large transactions, and improper configurations. If not, collect relevant information and contact OceanBase Technical Support.
Common causes
The solution to a tenant memory overrun exception varies with the root cause. The following content describes the solutions in descending order of preferences and benefits:
Large queries: For a tenant memory overrun caused by large queries or bad SQL statements, locate the SQL statement that causes the issue and optimize the SQL statement to reduce the memory consumption, thus preventing the alert.
Large transactions: For an "insufficient tenant memory" error caused by large transactions or batch data import or export, locate the large transaction that causes the issue and optimize the transaction processing to eventually turn the large transaction into small transactions.
Improper tenant variable configurations: If the SQL statements and transaction size have been minimized to the greatest degree allowed, set
ob_sql_work_area_percentageto a larger value for the tenant to increase the memory allowed for a session. The default value is 5, indicating 5% of a single memory resource unit of the tenant. The variable can be configured at the global level. The recommended value range is [5,80].Sample statement:
Global level
obclient> SET GLOBAL ob_sql_work_area_percentage = xxx;
Scale up the memory resources for the tenant. If the alert is not triggered by all the preceding causes, the issue may be caused by insufficient tenant memory. In this scenario, you may scale up the memory resources for the tenant. For more information, see Overview of tenant management. If the alert is caused by a minor compaction exception or a major compaction exception, see Troubleshoot major compaction exceptions.
Collect relevant information
Locate the module that uses increasing memory and monitor the memory allocation for this module. After the exception recurs, identify the cause of growing memory consumption or leakage. Perform the following steps:
Locate the problematic module
Query the
__all_virtual_memory_infotable. Sample command:SELECT * FROM __all_virtual_memory_info ORDER BY used desc limit 10;View logs in the
observer.logfile and find the modules that consume the most proportion of memory. The following figure shows the memory consumption of modules in the observer.log file.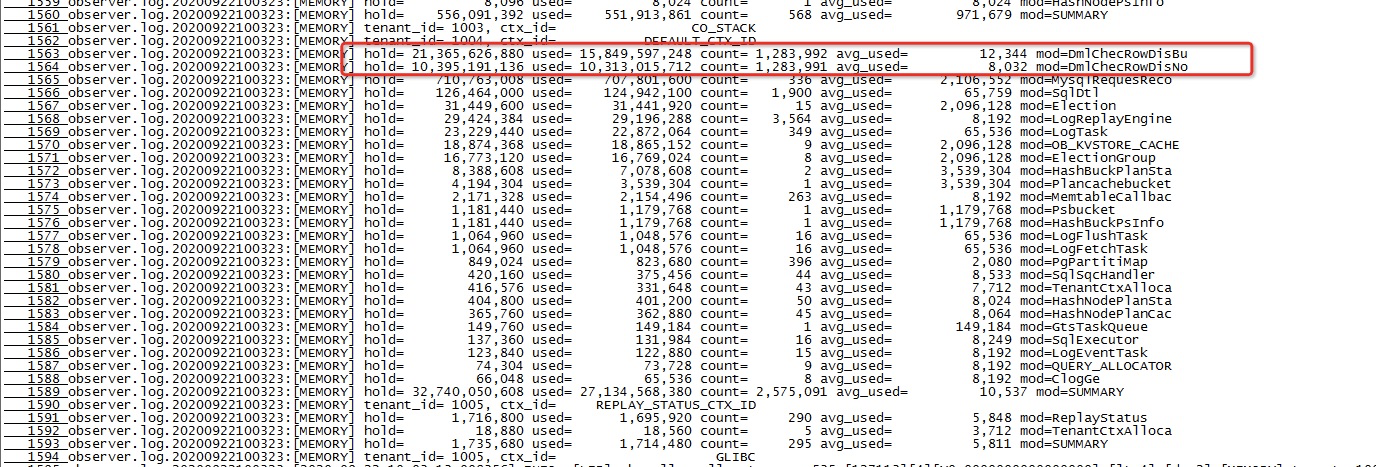
Enable memory allocation monitoring for the module.
ALTER system SET leak_mod_to_check='xxx';The following sample statement shows how to obtain the memory allocation code path of the
OB_TEST2_PCODEmodule in the libeasy context:ALTER system SET leak_mod_to_check='OB_TEST2_PCODE'Observe the exception recurrence.
Monitor the memory usage of the module and observe the exception recurrence by checking the
observer.logfile or querying the__all_virtual_memory_infotable as instructed in Step 1.Execute the following statement and save the returned results in plain text:
SELECT * FROM __all_virtual_mem_leak_checker_info ORDER BY alloc_count;Stop memory allocation monitoring.
You can obtain the memory allocation code path in the returned results in Step 4. The path is a hex value of the memory address and indicates the cause for growing memory consumption or leakage. You can execute the following statement to stop memory allocation monitoring:
ALTER system set leak_mod_to_check= '';Run the
addr2line -pCfe $observer $back_tracecommand to print the stack information in theback_tracefield obtained in Step 3. Example:addr2line -pCfe /home/admin/oceanbase/bin/observer $back_traceSend the information obtained in Steps 3, 4, and 6 to OceanBase Technical Support for assistance.