Slow SQL statements are statements whose execution time exceeds 100 ms. You can use the SlowSQL diagnostics feature to identify risky statements and avoid risks.
Set the execution time threshold that defines a slow SQL statement
By default, an SQL statement is considered a slow SQL statement if its execution time exceeds 100 ms. You can perform the following steps to modify the default threshold that defines a slow SQL statement:
Execute the following SQL statements in a command-line tool or OceanBase Developer Center (ODC) to change the default slow SQL statement threshold to 120000 μs.
select collect_elapsed_threshold_us from ob_agent_collection_config_history
where collection_name = 'slow_sql';
update ob_agent_collection_config_history set collect_elapsed_threshold_us = 120000 where collection_name = 'slow_sql';
Change the value of the OceanBase Cloud Platform (OCP) system parameter ocp.ob.slowsql.threshold to 120000 μs.
Procedure
You can diagnostics Slow SQL by using one of the following methods.
Method 1:
Log on to the OceanBase Cloud Platform (OCP) console.
In the left-side navigation pane, click Autonomous Services to go to the Real-time Diagnostics page.
The SQL Diagnostics page automatically appears.
Method 2:
Log on to the OceanBase Cloud Platform (OCP) console.
To go to the O&M page of the tenant.
In the left-side navigation pane, click SQL Diagnostics to go to the SQL Diagnostics page.
The following takes Method 1 as an example.
Log on to the OceanBase Cloud Platform (OCP) console.
In the left-side navigation pane, click Autonomous service.
In the Cluster Details section, click the name of the target cluster.
By default, the SQL Diagnostics tab of the Real-time Diagnostics page appears.
The SQL diagnostic data is not displayed on the SQL Diagnostics page if you do not set the values of both the cluster parameter enable_sql_audit and the tenant parameter ob_enable_sql_audit to true. You can click Change Cluster Parameters in the prompt to modify the parameter values.

Click the SlowSQL tab.
Filter slow SQL statements.
Specify the filter conditions.
Time Range: You can select Last 5 Minutes, Last 10 Minutes, Last 20 Minutes, Last 30 Minutes, Last 1 Hour, or Last 3 Hours from the Time Range drop-down list. You can also select Custom Time from the drop-down list and specify the start time and end time as needed. By default, the information of the last 30 minutes is displayed.
OBServer: You can select an OBServer or All OBServers in the list. If you select an OBServer, only SQL statements executed on the selected OBServer are queried.
Internal SQL: If you select this option, the SQL statements internally initiated in OceanBase Database are displayed in the query result.
Keyword: The SQL statements that contain the specified keyword are displayed in the query result.
Advanced Search: You can select metrics such as SQL ID, Executions, or Executions per Second from the drop-down list and specify the value range. The SQL statements that match the specified criteria are displayed in the query result.

Click Search to list all SQL statements that meet the search criteria.
Click Export SlowSQL to export all the SQL statements in the query result.
View the information of slow SQL statements.
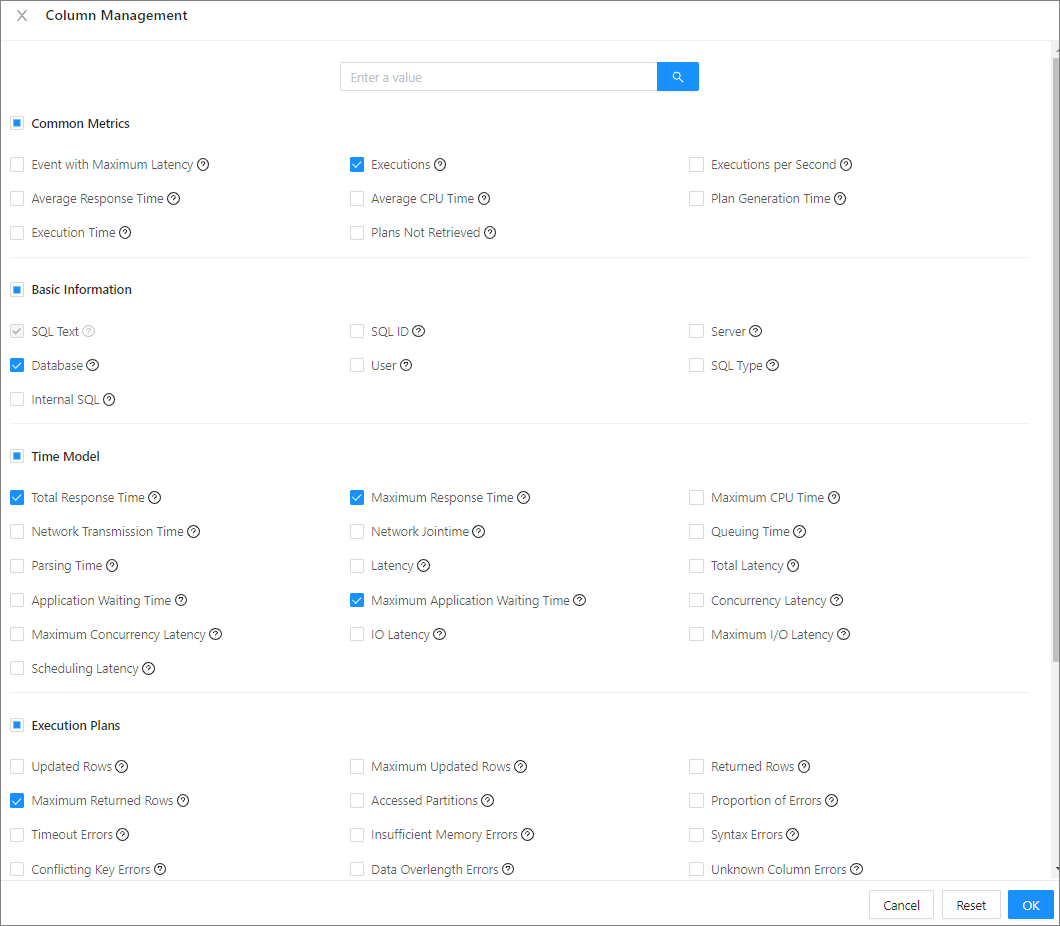
Click Column Management . In the dialog box that appears, select the columns to display. Then, you can view the selected columns in the SlowSQL list.

On the SlowSQL tab, you can view the columns selected. You can copy the SQL text of an SQL statement, filter the SQL statements by database and user, and sort the SQL statements by the number of executions, total response time, response time, and CPU time.

You can click the SQL text of an SQL statement to go to the SQL Details page of the statement.
On the SQL Details page, you can view the following details of the SQL statement:
In the SQL Text section, you can view the complete SQL statement.
In the Optimization Suggestions section, you can view the optimization suggestions for the SQL statement. For more information, see View optimization suggestions.
In the SQL Sampling section, you can view the details of the slow SQL statement. You can select Last 5 Minutes, Last 10 Minutes, Last 20 Minutes, Last 30 Minutes, Last 1 Hour, or Last 3 Hours, or select Custom Time and specify a time range to view details of the SQL statement, such as the trace ID, request time, response time, execution time, physical reads, application latency, returned rows, server IP address, and client IP address. You can copy the trace ID. You can also sort the SQL traces by request time, response time, execution time, physical reads, application latency, and returned rows.
On the Previous Tendency tab, you can view the historical trends of the SQL statement. For more information, see View the historical trends of an SQL statement.
On the Execution Plans tab, you can view the execution plans of the SQL statement, or bind an execution plan to the statement. For more information, see View the execution plans of an SQL statement.
On the Index tab, you can view the indexes bound to the SQL statement. For more information, see View and bind indexes.
On the SQL Throttling tab, you can view or set throttling of the SQL statement. For more information, see Set SQL throttling.
You can view the binding records of the SQL statement in section ① as illustrated on the Execution Plans , Index , and SQL Throttling tabs.

In the binding records, you can view the status of a bound execution plan, or click Unbind to unbind the plan from the SQL statement. You can click Bind Plan to bind the plan to the SQL statement again.
Set throttling.
You can click Enable Throttling to enable throttling for the SQL statement. For more information, see Set SQL throttling.
Select multiple SQL statements and click Batch Set Throttling . In the dialog box that appears, specify the maximum number of SQL statements that can be executed concurrently.
Note
Keyword-based throttling is not supported in batch throttling.

