On the Overview page of a cluster, you can view its basic information, resource usage, alerts, system events of the last seven days, zones, and OBServer nodes, and can perform routine cluster maintenance.
View the basic information
You can view the parameters of a cluster on its overview page: Cluster Name, Cluster ID, Cluster Type, OceanBase Database Version, Regions, Deployment Mode, CPU Architecture, Servers, Partitions, Tenants, Created By, OBProxy Cluster, Log Transfer Mode, Synchronization Status, Protection Mode, Software Installation Path, Data Disk Path, Log Disk Path, ConfigUrl, and Tag.

Parameter |
Description |
|---|---|
| Cluster Name | The name of the cluster. Click the copy button on the right to copy the cluster name. |
| Cluster ID | A unique cluster ID that is automatically generated when the cluster is created. |
| Cluster Type | The type of the cluster. Valid values: Primary Cluster and Standby Cluster.Note |
| OceanBase Database Version | The OceanBase Database version of the cluster. |
| Regions | The number of regions in the cluster. |
| Deployment Mode | The deployment mode of the cluster. |
| CPU Architecture | OCP automatically identifies the hardware architecture of the host when it is added. If multiple different hardware architectures exist in the cluster, the information about all hardware architectures is displayed. |
| Servers | The number of hosts in the cluster. |
| Partitions | The number of partitions for the tables in the cluster. |
| Tenants | The number of tenants in the cluster. |
| Created By | The username of the user that created the cluster. |
| OBProxy Cluster | The OBProxy cluster that is associated with the current OceanBase cluster. |
| Protection Mode | This parameter is displayed only for the primary cluster. For more information, see Protection modes.Note |
| Software Installation Path | The software installation path specified when the cluster was created. |
| Data Disk Path | The data disk path specified when the cluster was created. |
| Log Disk Path | The log disk path specified when the cluster was created. |
| Log Transfer Mode | This parameter is displayed for a standby cluster. Valid values: Synchronous and Asynchronous. When the log transfer mode is Synchronous, the synchronization mode can be Asynchronous, depending on the protection mode. |
| Synchronization Status | The latency of log transfer. This parameter is displayed for a standby cluster. |
| ConfigUrl | The cluster URL. You can click the copy icon to copy it. |
View resource usage
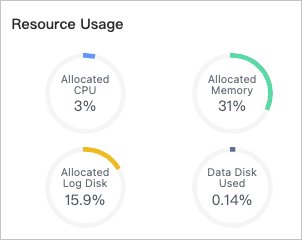
In the Resource Usage section, you can view the following information about the current cluster: Allocated CPU, Allocated Memory, Allocated Log Disk, and Data Disk Used. You can manage the cluster based on the resource usage.
Note
If the cluster version is earlier than OceanBase Database V4.0, the Allocated Log Disk information is not displayed in the Resource Usage section.
View alerts
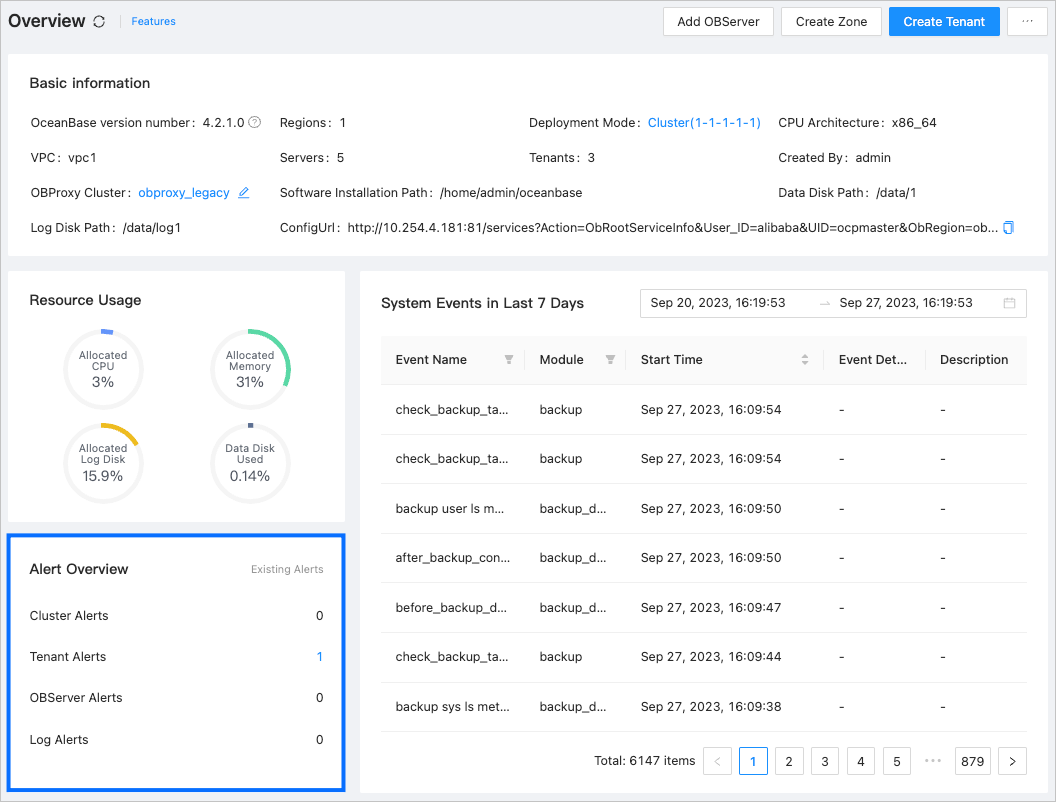
In the Alert Overview section, you can view different types of alerts, including cluster alerts, tenant alerts, OBServer node alerts, and log alerts.
View system events in the last seven days
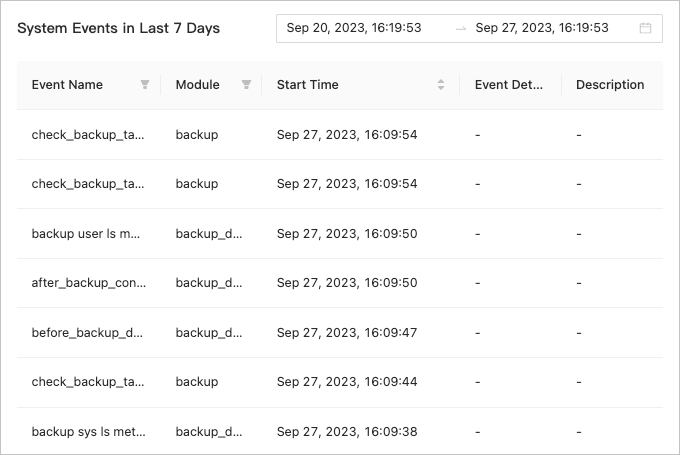
You can set query conditions in System Events in Last 7 Days to query the system events in the last seven days.
You can specify a time range in the time selection field.
You can filter events in the Event Name column.
You can filter events by module.
You can sort events in ascending or descending order by start time.
The system lists the system events that meet the foregoing conditions you specified.
View zones
In the Zones section, you can view the following zone parameters and search for zones by these parameters: Zone Name, Region, IDC, Servers, RootService, CPU Architecture, and Status. The Actions column provides the following options: Add OBServer, Restart, Stop, and Delete. For more information, see Add an OBServer, Restart a zone, Stop a zone, and Delete a zone.

View the OBServer node list
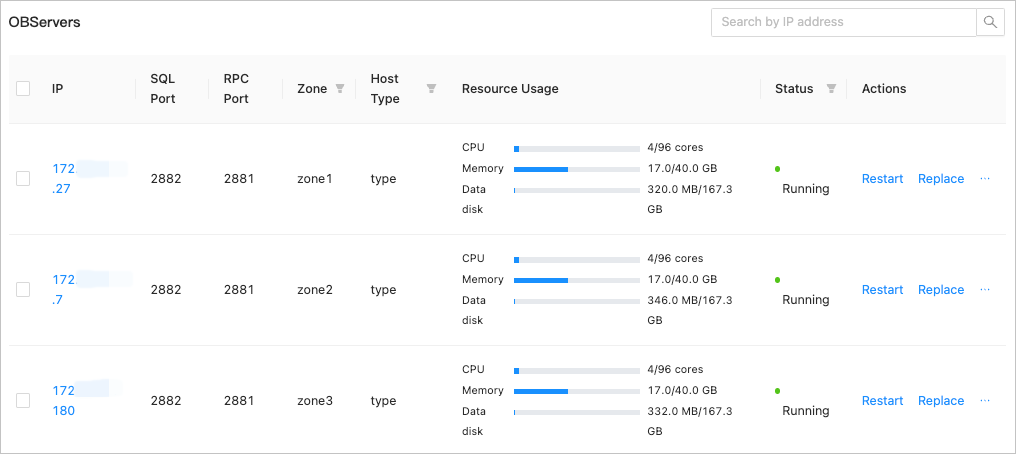
In the OBServer node list, you can view the following OBServer node parameters: IP, SQL Port, RPC Port, Zone, Host Type, Resource Usage (CPU, Memory, and Data disk), and Status.
- When an OBServer node becomes unavailable, hover the pointer over the Unavailable icon to view the duration and cause of the unavailability and the corresponding solution.
- The Actions column provides the following options: Restart, Stop Service, Stop Process, Reinstall, Replace, Delete, and Download Logs. For more information, see Restart an OBServer node, Stop an OBServer, Stop the observer process, Reinstall OBServer, Replace an OBServer node, Delete an OBServer node, and Download logs.
View the arbitration service list
In the Arbitration Service List section, you can view the following arbitration service parameters: Endpoint, Status, Added At, and Service-Enabled Tenants. You can click the Service Address to go to the Arbitration Service details page. The Actions column provides the following options: Add Arbitration Service, Replace Service, and Remove Service. For more information, see Add an arbitration service, Replace an arbitration service, and Remove an arbitration service.

Perform cluster management operations
You can perform basic cluster management operations on the Overview page of a cluster. For more information, see Add an OBServer, Add a zone, Create a tenant, Create a standby cluster, Upgrade a cluster, Change the password of the sys tenant, Restart a cluster, Stop a cluster, Delete a cluster, Decouple a standby cluster from the primary cluster, Enable automatic detection of deadlocks, Disable automatic detection of deadlocks, Download logs, Disable SQL collection, and View the SQL collection history.
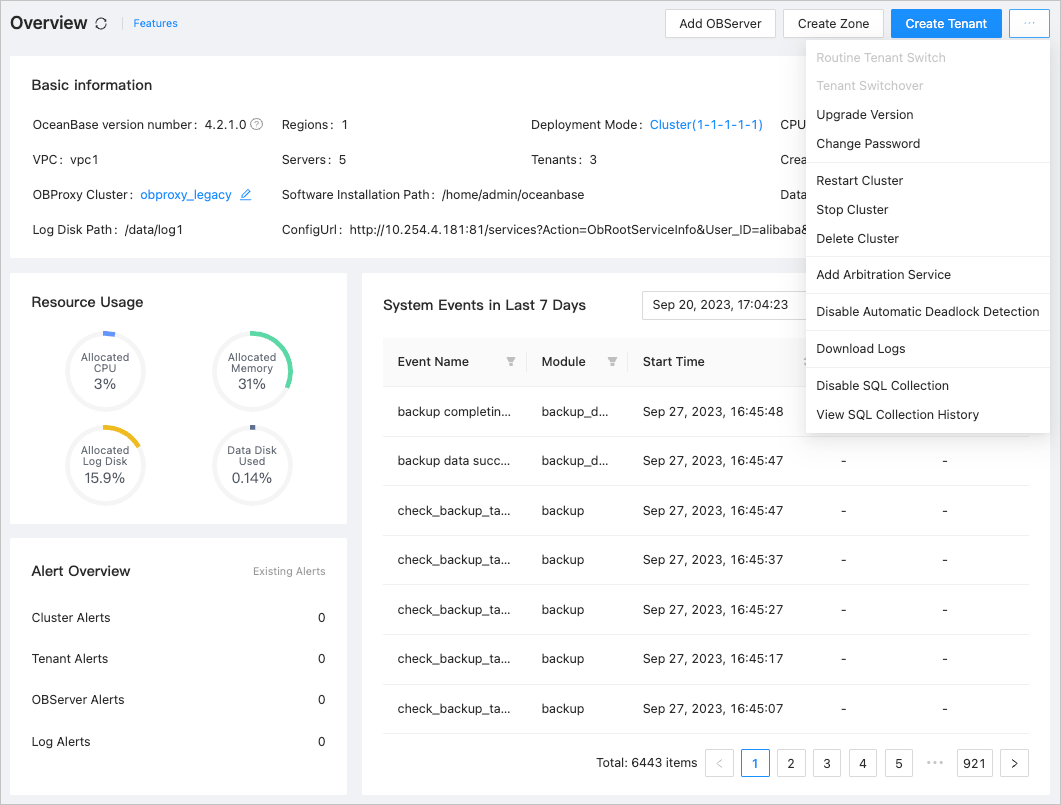
You can also perform routine O&M operations on a cluster by using the options in the left-side navigation pane. For more information, see View the topology of a cluster, Manage tenants, Performance monitoring, Performance report, Cluster resource management, Major compaction management, Backup and recovery, and Cluster parameter management.
Switch between protection modes
Maximum performance: It protects user data and maximizes the performance of the primary cluster. In this mode, the log transfer between the primary cluster and all standby clusters is asynchronous.
Maximum availability: Normally, the primary cluster keeps synchronous log transfer with only one standby cluster.
Maximum protection: The primary cluster keeps synchronous log transfer with only one standby cluster, and asynchronous log transfer with other standby clusters.
Switch between clusters
To view the information about another cluster, click the cluster name in the upper-left corner of the Overview page and select the target cluster to switch to its overview page.


